


1. Introduction
After almost two years from the start of COVID-19 pandemic, researchers and the global health community started to review the related devastating effects on the health and well-being of global population. This includes the procedural measures used for disease diagnosis caused by the infection with the severe acute respiratory syndrome coronavirus 2 (SARS-CoV-2) and eventually the level of disease severity. We believe that the ability to change and adapt current models and to combine them with early clinical information in response to the difficulties of COVID-19, as well as the new emerging strains and mutations of the virus, is improved by artificial intelligence (AI) and machine learning (ML) techniques. If our communities are unable to get the finest ML solutions predicted during the pandemic, we firmly expect these technologies will be of greater assistance in the next pandemic.
The main screening method used for detecting COVID-19 cases is polymerase chain reaction (PCR) testing, which can detect SARSCoV-2 RNA from respiratory specimens (collected through a variety of means such as nasopharyngeal or oropharyngeal swabs) [1,2]. The limitation of the diagnosis made by human experts has been a key stimulus for the employment of computer technology to improve detection speed and accuracy. The manual contouring of lung lesions is another connected problem, which sometimes takes a laborious and time consuming amount of work and could lead to inconsistencies of evaluation afterwards. Thus, a fast auto-contouring tool for COVID-19 infection is needed in the onsite applications for quantitative disease assessment.
In many fields, the exploration and usage of AI, ML and other data analytics technologies have been increasing since the start of this disastrous catastrophe. In many sectors, AI and ML in a wide range of sectors have shown outstanding performance and proved their crucial significance in challenging therapeutic scenes. Currently, many AI and machine vision systems are used in disease diagnosis, examining, identifying, and treating patients, and evaluating disease progression. These systems have shown high level of accuracy in different applications, such as breast cancer, lung disease classification, identifying diabetic retinopathy, skin lesion classification, Alzheimer, and improving reconstruction for magnetic resonance imaging (MRI), X-ray and computerized tomography (CT) imaging [3-5].
In this paper, we present an exhaustive analysis of how ML can provide effective answers to the health impacts of COVID-19. More particularly, we provide ML algorithms and techniques that suggest possible solutions in investigating the disease severity level. In ML, algorithms are trained to find patterns and features in huge amounts of data in order to make decisions and predictions based on new data.
The availability of large amounts data and the related development of computer systems allow all this data to be processed more quickly and precisely, and make the rise in ML development conceivable. With the enormous advances in ML technologies, a wide variety of applications are being addressed through numerous linked disciplines. One such important discipline is patient management where image analysis tools (X-ray and CT scans) can support measurement of the disease extent within the lungs, thus generating quantification for the disease that can serve as an image-based biomarker. In the following sections, we discuss several techniques, approaches, and algorithms under the umbrella of machine learning that can be used for obtaining a “Severity Score” of COVID-19 infected patients.
2. Regression Analysis Techniques
Regression analysis is the process of estimating the relationship between a dependent variable and independent variables. In other words, the sampled data is fitted with an error function from a selected function family. Regression analysis is one of the most fundamental tools used for predictive machine learning. Regression is used in order to anticipate results for the future or hold-out data points for a function on the data provided. In this regard, Cohen et al. [6] and Zhu et al. [7] predicted lung disease severity scores using a linear regression model based on extracted features. In order to associate each score with a confidence value, Signoroni et al. [8] treated this task as a joint multi-class classification and regression problem using a compound loss function. The trajectory prediction can be obtained based on the severity assessment by calculating the difference in severity score between two neighboring X-ray images. Duchesne et al. [9] built a trajectory prediction model based on the extracted features from X-ray images using DenseNet-121, and used logistic regression to classify the trajectory into one of three categories: “Worse”, “Stable”, or “Improved”.
Moreover, Yan et al. [10] created a prognostic prediction method to forecast a person's mortality risk after infection, using data from 29 patients. Jiang et al. [11] presented another system that can predict with 80 percent accuracy which person affected with COVID-19 may go on to develop acute respiratory distress syndrome. By applying linear regression, multilayer perceptron and Vector Auto-regression model, Sujatha et al. [12] developed a strategy that might be useful in estimating the stretch of COVID-19. This method tries to anticipate the epidemiological pattern of the disease.
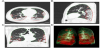
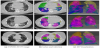
Also, Mader et al. [13] evaluated the potential of a fully AI-driven CT software prototype to quantify the severity of COVID-19 infection on chest CT scans in relationship with clinical and laboratory data. Pulmonary opacifications were automatically assessed by an AIdriven software and correlated with the clinical and laboratory parameters using Spearman-Rho and linear regression analysis. The software used to quantify the abnormalities of a lung calculates the percentage of opacity and the lung severity score by segmenting three-dimensional abnormalities such as ground glass opacities (GGO) and consolidations. These measures define the expanse of lung involvement and the allocation of involvement across the lobes. High opacity abnormalities like consolidations and subsolid regions were measured by percentage of high opacity and lung high opacity score, which define the extent of high opacity abnormalities and the distribution across the lung lobes. A lobe was classified as “affected” if the algorithm detected high opacity abnormalities in the defined lung part. An example of CT images showing postprocessing analysis and quantification results of the software prototype is shown in Figure 1.
3. Random Forest Approaches
Random Forest is a popular ML algorithm that belongs to the supervised learning technique. It can be used for both Classification and Regression problems in ML. It is built on the concept of ensemble learning, a method which combines several classifiers to solve a complex problem and increase model performance. Random Forest is a classifier that contains a number of decision trees on various subsets of the given dataset, and instead of relying on one decision tree, this technique takes the prediction from each tree and predicts the final output based on the majority votes of predictions.
In this context, researchers in [14] suggested a combination of features consisting of laboratory features, clinical, demographic information, and patient age through the employment of random forest and support vector machine (SVM) as the primary feature classification models [15]. Their finding was based on evaluating 253 clinical blood samples, where the researchers found that eleven key relevant indices can assist and be used as a discrimination tool. These eleven indices are: bilirubin, creatine kinase isoenzyme, GLU, creatinine, kalium, lactate dehydrogenase, platelet distribution width, calcium, basophil, total protein, and magnesium. The empirical results showed that the proposed feature combination results an overall accuracy of 95.95%, specificity of 96.97%, and area under the receiver operating characteristics (ROC) curve ROC of 0.9996 and 0.9757 for the training and testing datasets respectively. Also, the researchers in [16] implemented the random forest algorithm for severity analysis using CT Scans.
4. Deep Learning Algorithms
Deep learning is a machine learning subfield, which structures layer algorithms to form an artificial neural network that can learn and make intelligent decisions. In other words, deep learning algorithms are a sophisticated and mathematically complex progression of machine learning algorithms. The field has received a lot of attention recently due to the recent advancements in technologies that have led to solutions that were previously inconceivable.
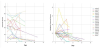
In this regard, a method to generate disease quantification is proposed in [17] to assess the relative severity of patients, and thus assist physicians in decision-making. This corona score is a quantification of the extent of opacities in the lungs. It can be acquired from CT and in X-ray images. Figure 2 presents a plot of corona score measurements per patient over time using CT cases. The measure can be used to analyze the relative severity of the patients (left) as well as construct a model for illness burden over the course of treatment (right). Further significant information on disease manifestation description can be recovered, such as the locations of opacities within the lungs, the opacity load within certain lobes of the lungs, and textural analysis of the opacities using patch categorization attained from the detected areas. Dong et al. [18] focused on CT manifestations at different stages of COVID-19 and discussed the quantitative CT metric changes with COVID-19 progression. In addition, they have depicted the contraction of lung lesions on CT images alongside a follow up of case treatment to assess the improvement during the disease course. The authors also explored how quantitative follow-up can improve radiologists' detection of imaging characteristics and assist them in making a prompt and accurate diagnosis. CT presentations of lung lesions can be studied based on different phases by classifying patients based on disease trends.
On X-ray images, Zhu et al. [19] used a deep-learning convolutional neural network (CNN) to stage the severity of COVID-19 infection. Expert chest radiologists determined the basic characterizations of disease severity ratings. Then, they conducted a comparison between traditional and transfer learning. Transfer learning transcends the isolated learning paradigm by applying information gained from one endeavor to address problems that are linked to it. Because the pre-trained weights enable more efficient training and improved performance, transfer learning is significant for small sample size data.
In more detail, on a graded scale, a CNN with an extra regression layer was used to predict infection severity ratings of X-ray. The images were normalized, converted to RGB format, down-scaled to 64x64 pixel size, and separated into 20% testing and 80% training datasets. To adapt the model to predict continuous values, the model architecture contained a convolutional layer, activation, dense layers, batch normalization, max pooling, and a final dense regression layer. Batch normalization layers stabilized the learning process by standardizing inputs, whereas standard rectified linear activation layers optimized performance.
Also, Wismüller and Stockmaster [20] proposed an approach to calculate surrogates for measuring important disease-related observational quantities over time, such as the prevalence of intracranial hemorrhage (ICH). To quantitatively investigate the clinical applicability of the approach, the authors analyzed service requests for automatically identifying ICH on head CT by performing AI-based prioritization of radiologists’ reading work lists with the goal to expedite timely therapeutic interventions in critical clinical conditions with emergent clinical findings such as ICH or pulmonary embolism. The obtained results suggest that the COVID-19 outbreak increased the number of actually observed ICH cases in emergencysetting noncontrast head CT studies above the statistically expected number of ICH cases.
Lessmann et al. [21] developed an interesting algorithm that scores chest CT scans of patients with doubted COVID-19 based on two scores. They referred to the first score as the COVID-19 Reporting and Data System (CO-RADS), and the second one as the CT severity score system (CTSS). The proposed system consists of three deep learning algorithms that automatically segment five pulmonary lobes, assign a CO-RADS score for the suspicion of COVID-19 and assign a CTSS for the degree of parenchymal involvement per lobe.
Based on characteristics identified on an unenhanced chest CT, the CO-RADS ranking system provides values ranging from 1 to 5 that rise with the amount of suspicion of COVID-19. Furthermore, in addition to assessing the possibility of COVID-19, it reports on the level of parenchymal involvement by assigning a CTSS to patients with a high suspicion of COVID-19. These standardized scoring systems allow for rapid and uniform clinical decision making. In their study, the CT scans were scored using three sequentially applied deep learning algorithms to accomplish the following: (1) pulmonary lobe segmentation and labeling, (2) lesion segmentation and CT severity score estimation, and (3) CO-RADS score prediction. The system uses a relational two-stage U-Net architecture for lobe segmentation and labeling.
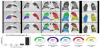
The diagnostic performance of the CO-RADS algorithm was evaluated using the ROC curves and the area under the ROC curve (AUC). The authors reported that the system recognized COVID-19 patients with high diagnostic performance, achieving an AUC of 0.95 on the test set and 0.88 on the external test set. Figures 3 and 4 show CO-RADS and CT severity score predictions for a COVID-19 positive case with extensive parenchymal involvement and a COVID-19 negative case, respectively. Moreover, Chassagnon et al. [22] investigated the use of medical imaging for disease quantification, staging and outcome prediction using CT imaging. The approach relies on a deep learning-based system that uses an ensemble of architectures, and a data-driven consensus for staging and outcome prediction of imaging biomarkers with clinical and biological attributes. Figure 5 shows the flowchart of the proposed approach.

Moreover, authors in [23] used multi-scale deep reinforcement learning for anatomical landmark detection and Deep Image to Image Network (DI2IN) for segmentation, based on a dataset of 8792 CT volumes. The overall extent of opacities is displayed by a reproducible and automatically calculated score ranging from 0-20, which is a sum up of five lung lobes. An opacity score of zero means that none of the lobes is affected whereas 20 represent extensive involvement of all five lobes. Lobe-wise, the score is calculated on the percentage of opacity per lobe, using a Likert scale from 0 to 4. Percentage of opacity, which represents the percentage of predicted volume of abnormalities compared with the total lung volume within a given region, is classified as follows: score = 0, 1, 2, 3, and 4 corresponds to extent of opacity ≤1%, ≤25%, ≤50, ≤75%, and >75% within a given region, respectively.
Furthermore, the authors in [24] developed a framework to segment lung lobes and pulmonary opacities. The volume ratio of pulmonary opacities inside each lung lobe gives the severity scores of the lobes, which are then used to predict ICU admission and mortality. For lung lobe segmentation, The authors employed a trained U-net model that includes an encoder with standard convolutions and max pooling layers, as well as a decoder with transposed convolutions. The network has 19 convolutional layers. Two 3×3 convolutional layers are used in each convolutional block in the encoder and decoder. Finally, a 1×1 convolutional layer is used to reduce the number of feature map channels into two. To enhance the model performance, residual connections between the encoder and the decoder are employed. Figure 6 shows an example of segmentation results of lung lobes and pulmonary opacities. Based on the area of pulmonary opacities, the ratio of opacity volume over lobes is computed to measure the severity. The developed method achieved AUC of 0.813 in predicting ICU admission and AUC of 0.741 in mortality estimation.
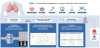
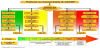
In a thorough discussion, Suri et al. [25] discussed how a machine learning system can characterize the tissues of COVID-19 patients and classify the severity of the infection accordingly. They presented four pathways that can lead to heart and brain injuries following a COVID-19 infection. The system categorizes the nature of a patient’s risk in one of the following categories: no-risk, low, low-medium (LM), high-medium (HM), low-high (LH), or high-high (HH) risk depending on the patient’s symptoms and his/her severity as shown in Figure 7.
As such, the system can play a role in the treatment of comorbid patients, based on probabilities derived from COVID-19 symptom statistics. Such symptoms include myocardial injury, hypoxia, plaque rupture, arrhythmias, venous thromboembolism, coronary thrombosis, encephalitis, ischemia, inflammation, and lung injury. The authors’ have argued that the patients with pre-existing diseases are likely to experience severe complications from COVID-19. In their study on 48 admitted diabetic and 145 non-diabetic COVID-19 patients, the mortality rate (81.3 % vs. 47.6 %) and rate of ICU hospitalization (66.7 % vs. 41.4 %) were considerably higher for diabetes patients. Diabetics also had significant inflammatory reactions as well as cardiac, hepatic, and renal coagulopathy. COVID-19 individuals with concurrent chronic disorders such as diabetes, renal disease, dyslipidemia, hypertension, chronic obstructive pulmonary disease, and cardiovascular disease had a greater prevalence of heart and brain damage.
Authors further discussed how the imaging modality also differs with the degree of risk as follows: no imaging for no-risk, portable imaging for low and LM risk, non-portable imaging for HM and LH, and invasive imaging for HH. Hence, the significance of a patient’s COVID-19 symptoms helps in determining which imaging modality is suitable: portable or non-portable, and invasive or non-invasive. For example, B-Mode ultrasound imaging is portable and can be used for low-risk patients. Meanwhile, X-ray, magnetic resonance imaging (MRI) and CT scan are non-portable and can be used for medium-risk patients. On the other hand, intravascular ultrasound and ventriculography are invasive imaging modalities that can be used in extremely critical cases.
Moreover, a deep learning-based platform was proposed in [26,27] to deal with COVID-19 patients having comorbidities. The data was given in the form of ultrasound scans following specific guidelines. In addition, Jamthikar et al. [28] described how ML may be used to estimate the risk of cardiovascular disease within a big data environment by combining image-based phenotypes and traditional risk factors for CCA and bulb segments. Finally, Lassau et al. [29] predicted the level of severity of hospitalized patients by integrating clinical, biological, and radiological data with a deep learning CT scan analysis. They constructed a multimodal severity score that includes five variables (age, sex, oxygenation, urea, and platelet) in addition to the deep learning model.
5. Discussion
The employment of technology to combat the pandemic poses problems in a variety of sectors and from many perspectives. According to the findings of this study, healthcare stakeholders do not use the same systems, data formats, or standards. This might block the capacity to discover potential trends in pandemic-related solutions and establish interventions among the linked initiatives. To better comprehend the emerging pandemic and make collaborative decisions not just to address current crisis, but also to prepare for future ones, public health experts, epidemiologists, and government officials must be connected via integrated systems with connected data.
Since the coronavirus may undergo further natural selection and evolve geospatially as the pandemic progresses, understanding this evolution and the uncertainties that accompany it is important. To address this issue effectively, the degree of uncertainty in knowledge about the disease needs to be quantified in order to be able to understand the risks and benefits of the clinical and social policies employed. Catalyzing the scaling up of AI and ML implementation in the health sector is a crucial critical activity that has to be made to enable the best possible defense against pandemic(s).
Multiple observational studies based on a range of data sources, including clinical data, samples, and imaging data, have emerged in response to the COVID-19 catastrophe to promote research into disease risk, disease trajectory, and the development of diagnostic and prognostic tools. All of these studies agree that having access to high-quality data is critical, and acquiring it has proven difficult. According to the in-depth analysis and thorough investigation offered in this paper, researchers and decision-makers must cope with the ever-increasing volume of data known as big data, being such a serious challenge in relation to determining appropriate approaches to solve COVID-19 problems.
The preceding discussion and analysis provide new platforms for a variety of future research topics. Researchers and specialists in the field of machine learning are highly encouraged to look into various domains. For example, ML can demonstrate its capabilities in fusing information from multi-source data by merging imaging data with clinical symptoms and laboratory examination findings. As a result, more accurate diagnosis, analysis, and follow-up should be possible. Furthermore, the current suggested methods are focused on abnormality identification in a biased pandemic scenario with a high proportion of patients presenting with the disease. Once the pandemic has passed, the focus will immediately move to the need to identify COVID-19 in a multitude of diseases. The concern remains as to whether the present proposed methods are sensitive enough to avoid too many false positives.
6. Conclusion
This paper is an attempt to provide a detailed study on how ML can help in various domains related to COVID-19, specifically in the areas of disease diagnosis using X-ray and CT imagery and the related disease severity. In general, and in relation to COVID-19 in particular, ML systems have the capacity to detect and evaluate any irregularities in health situations. ML solutions have been shown to help distinguish coronavirus patients from individuals who do not have the disease and to aid in tracking the virus development. Our study has demonstrated that positive discoveries might be tracked more quantitatively and often using ML methods. This might lead to more effective early case detection and control.
Integrating COVID-19-related clinical data with current biobanks, as well as pre-existing patient data (if accessible), such as genotype and physiological parameters, might help to enhance efforts toward a better and more realistic approach to useful data mining. Future ML research will benefit from a centralized collection of international COVID-19 patient data in order to create predictive, diagnostic, and therapeutic tactics against COVID-19 and related pandemics. If our communities were unable to achieve the greatest possible AI and ML solutions during this epidemic, we are certain that these technologies will be of greater assistance during the next pandemic.
Competing Interests
The author declare that there is no competing interests regarding the publication of this article.
Acknowledgments
The author would like to express his gratitude and grateful appreciation to the Kuwait Foundation for the Advancement of Sciences (KFAS) for financially supporting this project.