


1. Introduction
Railway signal pre-emption is intended to improve safety at road– railway intersections by minimizing the likelihood that a vehicle will become trapped at the crossing. When a train passes the crossing, vehicles on the road may be queued towards and away fromthe intersection. As vehicular queuing may affect driver behaviour, identification of the queue length needs to be taken into account. This paper addressesthe potentially dangerous conditions caused by a traffic queue backing up over an adjacent traffic control device located downstream from the crossing. Vehicles may become trapped at the crossing when the warning system is initially activated. The pre-emption of traffic signals at intersections near railway crossings induces traffic queues at the intersection not to extend over the railway crossing. In this way, vehicles do not block the train on the tracks [1].
There have been many recommendations, which have emphasized the need for railway pre-emption. Although these various guidelines have described how to implement and maintain the pre-emption setting in detail, there is still opportunity for engineers to investigate the specific local conditions because each site has different characteristics, such astraffic flow, train headway, signal phases, intersection geometry, and so on. A pre-emption sequence should also correspond to active warning devices, such as boom barriers with flashing lights or sounds [2]. Pre-emption also helps reduce delays by reducing the number of cycle times. This leads to reduced travel time and ultimately decreases social cost [3].
Despite the fact that signal pre-emption has been implemented and has had positive impacts on safety, there has been little research on analysing and evaluating its performance. This is because setting up signal control is a complex process that takes into account traffic conditions, such as traffic volume, weather, existence of safety control, and intersection geometry in real life [4].
Traffic simulation can help in analysing performance and safety with less cost and less labour. Microsimulation can be used in a detailed study of the different types of traffic queues, and how to manage them. Such a study can help resolve the likelihood of conflicts and also can help practitioners to analyse traffic flow interactions. As processes or assessment procedures in past research are rare [5], traffic simulation can help prioritize areas where pre-emption is needed.
In this research, micro-simulation was used to analyse performance with the use of the signal preemption. A situation in which a traffic queue backs up over the crossing from an adjacent traffic control device located downstream from the railway crossing has been analysed in detail. For evaluation purposes, indicators, such as delay, speed, adequate signal timings, and the number of stops for vehicles on the road, have been used. The main objective of this research was to predict accurate traffic performance and to ensure safety for any particular traffic situation by using traffic simulation.
This paper is structured as follows: The next section critically reviews how signal pre-emption has been developed and applied. This is followed by a detailed description of the calibration and the proposed procedure. A case-study is then presented of an actual application of the proposed methodology using a specific example from Brisbane, Australia. The results of before and after pre-emption are shown at this stage. Finally, the main findings and conclusions are put forward.
2. Past work
According to a US report released in 2004, 94% of accidents at US railway crossings in the previous10 years were due to aggressive driving behaviour or poor driver judgment [6]. It has been known that these causes are significantly influenced by many factors, such as an existence of protectors (boom barriers, warning lights), and environmental geometry near and adjacent to railway crossings [7]. Since the Manual on Uniform Traffic Control Devices for Streets and Highways (MUTCD) was first published in 1935, several revised editions have been released, the latest in 2009. The 1948 edition stated that installing a supporting signal was recommended at a railway crossing to coordinate with traffic signals at the intersection [8]. The technical term Pre-emption was first introduced and was defined as a transition from a normal signal control to a special signal control in traffic operation in the 1961 MUTCD [9]. The necessity of the adoption of pre-emption is determined by thefollowing criteria published by the Institute of Transportation Engineers in 2006 [10]:
- Highway traffic queues have the potential for extending across a nearby rail crossing; or
- Traffic backed up from a nearby down-stream railroad crossing has the potential to interfere with signalized highway intersections.
In 2002, the IEEE (Institute of Electrical and Electronics Engineers) issued standards for the interface between the rail subsystem and the highway subsystem at a highway rail intersection. The purpose of these standards was to enhance safety by changing a communication system from an analogue interface (voltage) to a digital interface which ultimately would allow flexibility of information [11]. If the distance between the railway crossing and the intersection is about 60m then pre-emption needs to be considered, as recommended by the MUTCD [8]. However, in many cases pre-emption also should be considered when the distance is further than 60m [10,12,13] as it was found that vehicles could back up over 60m. A Poisson distribution is applied which uses therandom arrival of vehicles, approach volume, cycle length and assumed probability level [14,15]. Therefore, regardless of the distance between a rail crossing and a road intersection, the process of whether pre-emption is needed is important for safety [16].
Due to the complexity and the specific location consideration, Korve [1] suggests that designing preemption signals needs to consider three parameters as follows:
- the time needed following the start of the pre-emption sequence for traffic signals to complete the transfer of the right-of-way to the grade crossing warning signal;
- the time for vehicles stopped within the minimum track clearance distance to move through the crossing; and
- the time the minimum track clearance distance must be clear of vehicles prior to the train’s arrival.
In order to ensure that signals allow vehicles appropriate time to clear the track when a train is approaching, road and rail agencies and authorities have to collaborate [17,18]. Because poor communication between those parties might result in significant loss and joint inspections are also important to ensure that interconnected systems continue to synchronize in a correct way [19].
Two types of traffic signal pre-emptions are widely used, namely: simultaneous pre-emption and advanced pre-emption. The difference between two techniques is when the system is activated. While with simultaneous pre-emption, the signal controller start activating as the warning devices are activated at the same time; with advanced pre-emption the signal controller starts activating before the warning devices are activated. Therefore, under simultaneous pre-emption technique, the time taken for clearing the queue on the track is not more than 20 seconds. On the other hand, the advanced preemption time is required for more than 20 seconds minimum to provide safety to the road vehicles. According to the MUTCD (Manual on Uniform Traffic Control Device) (8), the definition of two techniques is as follows:
- Simultaneous Pre-emption: the notification of approaching rail traffic is forwarded to the highway traffic signal controller unit or assembly and railroad or light rail transit active warning devices at the same time.
- Advance Pre-emption: the notification of approaching rail traffic that is forwarded to the highway traffic signal controller unit or assembly by the railroad or light rail transit equipment in advance of the activation of the railroad or light rail transit warning devices.
In the case that simultaneous pre-emption does not obtain enough time to clear the track, advanced pre-emption needs to be considered as an alternative. Depending on road geometry, minimum warning time, and traffic flow, the railway authority often requests advanced pre-emption technique when traffic safety cannot beguaranteed [20]. In this study, advance pre-emption technique is considered as one of three options (fixed signal time; pre-emption with actuated signal; and actuated signal only).
3. Proposed Methodology
3.1 Objectives
This paper will demonstrate how the traffic simulation can be applied to evaluate traffic efficiency and safety fora signalized intersection located nearby railway crossings. Following a previous study [21], the developed model has been modified by adding a signalized intersection with activated signal controllers. The modelis able to produce detailed outputs such as queue length, different types of delay in various traffic inputs and time intervals by different types of safety devices. However, this study focuses more on implementation of the pre-emption system using a traffic simulation platform.
The model put forward here can be used before actually setting up expensive and time-consuming structures. The inputs needed include: traffic volumes; road geometry of a signalized intersection and railway crossings; distance between those two structures; the speed of approaching trains. In order to ensure the validity of the developed model, a calibration process was performed against the start-up delay model developed by Gary Long [13]. The input assumptions related to traffic flow were derived using the outputs of a Brisbane based transportation model [22].
3.2 Selection of traffic simulation
With a big advance of computer memory capability, many traffic simulation packages are commercially available, such as AIMSUN2, FLEXSYT II, CORSIM, HUTSIM, INTEGRATION, PARAMICS, MICROSIM, TRAFNETSIMand VISSIM. These simulation tools are used for evaluating traffic flow efficiency, an adequate signal planning, a traffic management, and so on. In the safety context, current traffic simulation packages are not able to simulate such a situation in which any kind of vehicles are involved in collisions in general. Because, they are operated under an assumption that all vehicles in the network have a certain safety distance each other. Therefore, PARAMICS, AIMSUN and VISSIM are popular to use in Australia due to an easy use of an application programme interface (API), which allows modification for the user’s specific purpose.
In this study, VISSIM was selected after reviewing the functionality, accessibility, and ease of use. As VISSIM has the most detailed network and traffic control models that consider vehicle widths and lateral movements within and between the lanes, it is deemed a more appropriate tool to model networks with detailed interaction between vehicles [23].
Another advantage of using VISSIM as a base for traffic simulation is that external signal controllers are provided. There are several external signal controllers available in VISSIM, one being vehicle actuated programming (VAP). Detectors in VISSIM’s network keep on identifying the position of vehicles and call on VAP logic if any req uest is triggered. Each detector sends inform ation of vehicle status such as eadway, im pulse, occu pancy, vehicle ID, vehicle length, speed, and so on. Additionally, th e current traffic situati on is reported in the VAP logic so th at signal controllers ca calculate appropriate timings.
Like most traffic simulation, the stat of vehicles, the attributes of all object components, or the phase of s ignal contr oller can be modified d uring the simulation run at a frequency of 0.1 to 1 seco nd. This modification can be made not only for the co plete simulation time ut also for a specific time slice when the si mulation returnsto the c ontrol of VISSIM’s built-in-models. For the purposes of th is study, lane changing models are not es sential for evaluating safety near or at railway crossings. The methodolog of using traffic simulation is the key and this can be extended to la rger networks where vehicles might need to change lane s to save travelling time.
3.3 Pre-emption sequence
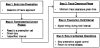
Traffic pre-emption controllers currently follow five basic pr ocedures as shown in Figure 1. The first step, Entry into Pre-emption, detects the train’s approach to the crossing a nd immediately initiates the premption se uences [12]. The next step, Terminate the Current Phses, determines if the vehicle phases need to be terminated or extended. During the third step, Track Clearance Phases, andequate signal green time is allocated in order to clear a queue. The fourth step, the Pre-emption Hold Interval, is performed to ensure the train has left the crossing. The last step, Return to Normal Operation, commands the controller to cease the pre-emption sequence and return the signal controller to normal.
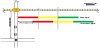
Under normal condition s, when a train approaches and passes through between D1 and D2 shown in figure 2, the active warning devices equipped with flashing lights and boom barriers are initiated. During this period, drivers makes a decision whether they ignore or comply with the warnings as if they are in a dilemma zone on a road intersection during amber time. When any queued vehicles are still in the conflict area, a pre-emption signal controller needs to be activated. When the pre-emption is perated, the controller needs to check which phases are currently ctive. Depend on which phase is active, a logic of the signal sequences has to be change.
During step 3 in Figure 1, calculating the clearance time is critical to allocate the minimum track clearance green time. The pre-emption time should be bigger than the clearance time for sfety purpose. When the clearance time is ca culated, the signal controller commands to change the sequence of the phases so that vehicles heading to the intersection obtain an appropriate minimum green time. Until the train impulses detector 2 (D2 ) shown in Figure 2, the last vehicle in the queue is able to clear the trap zone (here, the trap zone is regarded as the area where collisions might happen unless car drivers proceed with care). Immediately after clearing the trap zone, warnings (flashing lights or sounds) are a ctivated. After that, the signal controller operates the phases as normal.
When trains are not present near to or at the crossing, the order of signal phases are changed dynamically based on the number of vehicles approaching the intersection. Detectors on each approach check if the headway is more than a certain time (3 seconds is assumed here). Then the signal controller changes to the next phase where the headway is less than the threshold.
The VISSIM traffic simuation model [24] was designed so that after the flashing lights are on for 7s, the boom barries on both sides of the crossing descend for 13s in total to complete the lowering sequence. The boom barriers remain lowered until the train has passed the crossing. For the pre-emption s equence, the signal controller starts checking if the train has crossed D1 approximately 25 seconds before the flashing lights are activated.
3.4 Calibration
To improve the accuracy of the traffic simulation, a calibration process was performed before analysing the effect of pre-emption. In this particular study, parameters such as average standstill distance, maximum acceleration, desired acceleration and the size of passenger car and truck were key elements to be investigated.These parameters were calibrated based on clearance time.
Clearance time is a key element in order to operate signal preemption efficiently. The location of the detector for a train and signalvary depending on how much time is required for a queue to be cleared. Clearance time is calculated on the basis of the distance between the stop lines at an intersection and the crossing, the speed of the shock wave, and the type of vehicles in the queue.
3.4.1 Time to clear a trap zone
When high volume road traffic is stopped by an approaching train, a shock wave is likely to develop. In discrete traffic flow, the shock wave is generated by sudden large variations in the speed of the vehicles [25]. Therefore, the shock wave speed needs to be considered to estimate time for the last vehicle to be out of the trap zone.
Time (tl) taken by the last vehicle starting to move in a queue can be calculated by adopting simple equations derived from shock wave theory:
Where Q: length of the queue (m) uw: shock wave speed (km/h) qs: traffic ratio of saturation kj : density (veh/h)
3.4.2 Start‐up delay
Estimating the time to clear a trap zone is not astraitforward process, although the theoretical background is well defined. Long [13] developed a simple model to calculate the time called startup delay. As start-up delay is the main part of clearance time, this delay is associated with a shock wave which spreads vehicles in a line affected by changing circumstances. Start-up delay is influenced by the number of vehicles rather than the total length of accumulated vehicles in a queue. For example, 10 passenger vehicles of 6m each in a queue would likely take more time to clear a trap zone than 5 heavy goods vehicles of 14m each, since vehicles do not move all together at the same time. Start-up delay can be calculated as follows:
This equation can be replaced with:
Where:
dn = expected maximum start-up delay(s) at 99.9% confidence for a vehicle starting in the nth position from the front of a queue.
L = distance between a stop line at a signalized intersection and a trap zone, l = average length of vehicles in a queue. l = (6m+1m) ×the number of passenger car + (10m+1m)×the number of heavy goods vehicle.
For the purposes of geometric highway design, the American Association of State Highway and Transportation Officials (AASHTO) have presented standard physical characteristics of vehicles such as length, weight, width, and height [26]. In this paper, two types of vehicle have been chosen, namely; a passenger car of 6m and a heavy goods vehicle of 10m. For example, if vehicles are all passenger cars with 1m gap between each in a queue of 100m, the 17th vehicle would be in a trap zone. If vehicles are a combination of passenger cars (90%) and single unit trucks (10%), the 6th vehicle would be in the trap zone.
Within the 100m distance between the stop line and the beginning of the trap zone, the time at which the last vehicle was in the trap zone was extracted and compared to the time derived from Equation 3 [13].
The total number of vehicles (e.g. passenger cars and heavy good vehicles) can be the same, although the number of heavy good vehicles is different within a 100m length. For example, within 100m, 12 passenger cars and 1 heavy good vehicle extend up to 95m, whereas 11 private vehicles and 2 extend up to 99m.
Therefore, the results from Equation 3 are the same regardless of whether there is one or two heavy good vehicle in the queue. On the other hand, the traffic simulation software VISSIM takes into account the acceleration of different types ofvehicles. Thus it produces a slightly different result on the basis of the number of heavy good vehicles.
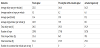
Calibration has been performed by comparing the time at whichthe last vehicle in a queue needs to start moving using Equation 3 and VISSIM. In VISSIM, after letting vehicles create a 100m queue, the startup delay was observed. By changing the number of heavy good vehicles as input, four scenarios were compared. Each scenario has a number of heavy good vehicles from 0 to 3 in the 100m queue. As shown Table 1, it is found that the simulation model can replicate well the results of Equation 3.
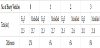
MUTCD recommends a 20 second minimum warning time prior to train arrival ata crossing (8). As shown in Table 1, 20 seconds is not sufficient time for the last vehicle to leave the trap zone. When warning times needs to be longer, drivers might behave more aggressively. Therefore, advanced preemption becomes important to avoid collisions.
3.5 Signal controller in traffic simulation
In order to choose the signal controller that provides the highest degree of safety with optimum efficiency, three types of signal controllers are developed and compared, namely; a fixed signal, a preemption with actuated signal, and actuated signal only. The fixed signal controller consists offour phases giving 30 seconds maximum green time to each direction. Three second amber time is allocated in between phases regardless of the number of approaching vehicles. For the actuated signal controller (pre-emption with actuated signal and actuated signal only), an external signal controller is notified of how many vehicles are waiting for the green time to cross the intersection. The difference between pre-emption with actuated signal and actuated signal only is that while the former does consider the time before activating the warning, the latter simply considers the traffic flow on the roadside only.
4. Case study
4.1 Study area
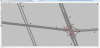
A railway crossing equipped with boom barriers and warning lights Brisbane, Australia, was selected and is shown in Figure 3. The railway crossing is located on the rail-line that stretches from Brisbane City to the northern suburb of Caboolture. At peak times the train frequency is 9~12minutes.
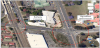
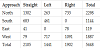
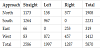
Traffic volume extracted from the Brisbane Strategic Transport Model (BSTM) with 2010 demand was used in this study [22]. Table 2 and Table 3 show that during the AMpeak 1,887 vehicles approach the intersection whereas 1,412 vehicles do soduring the PM peak time. It was assumed that heavy vehicles comprise 5% of total flow. The distance between the railway crossing and the signalized intersection is 190m.
From several earlier studies, a simple empirical model was provided to estimate the queue length atintersections [27,28]. Equation (4) has been used to confirm that with the peak traffic flows, a queue could extend over the crossing in this case.
Where Qb = Mean maximum back of queue in terms of a number of total vehicles Qm = Mean maximum queue length, V = Volume per hour C = cycle length, g = green time d = average vehicle length, N = Number of lanes F = Free-flow speed on the street (m/s)
For example, let v be 1887 veh/h as extracted from BSTM, C 100 seconds, and g 25 seconds. Then the number of vehicles (Qb) is about 44. These 44 vehicles can be accumulated up to 264 meters (44×6 meter) if each average vehicle length is 6 m and free flow speed on this street is 50km/h. Therefore, the queue at AM peak period can be extended over the crossing.
5. Simulation set up
The VISSIM model was run for 5,400 seconds in total including 900 seconds for ‘warm’ up and another 900 seconds for post-running. The analysis time was therefore 3,600 seconds. A timetable of the line was extracted for the peak time periods. Three north bound trains and seven south bound trains ran during the AM peak time.
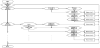
Figure 4 displays elements of the modified simulation model developed in VISSIM. Numbers (1 to 6) represent detectors while alphabets (A to D) represent signal phases. Properties of the links are mimicked with those of roads shown in Figure 3. Traffic for trains and road vehicles are input based on data as shown in Table 2.
In order to choose the signal controller that provides the highest degree of safety with optimum efficiency, three types of signal controllers were developed and compared, namely, a fixed signal, a pre-emption with actuated signal, and an actuated signal only. The fixed signal controller consists of four phases giving 30 seconds maximum green time in each direction. Three second amber time is allocated in between phases regardless of the umber of a pproaching vehicles. For the actuated signal controller (pre-emption with actuate d signal and actuated signal only), an externl signal controller is notified of how many vehicles are waiting for the green signal to cross the intersection. The difference between pr-emption with actuated signal and actuated signal only is that while the former does consider the time before activating the warning, the latter simply considers the traffic flow on the road.
5.1 Fixed signal
The fixed time signal is operated based on historical traffic flows at the intersection. This signal peration is most suitable for intersections where the variation of traffic flows for different days or time periods is rather low. One cycle (100 seconds) consists of red, green, and amber. A greed time for the A phase is 25 seconds followed by the B, C and D phase for 22, 22, and 18 seconds respectively. There are 3 seconds for amber in btween phases.
5.2 Pre-emption with actuated signal
Maximum green time for each phase is 25 seconds, whic means once any phase keeps green time more than 25 seconds, the signal moves to the next phase. In the case of low traffic, for example, when time gap between vehicles on each approach is 3 seconds or more, and there is at least one vehicle waiting for green light at the next phase, the signal moves to the next phase. While the signal plan operates in this matter, another detector keeps checking if a train is coming to the railway crossings. If train is coming and at the same time, a vehicle of an accumulated queue from the intersections stands stills on the detect or 5 as shown in Figure 4, the signal phase is changed to the phase A in order to release traffic stuck in the queue no matter which signal phse operates from (refer to Figure 5).
5.3 Actuted signl only
The actuated signal is not pre-calculated like a fixed signal. Detectors housed near the intersection identify the number of vehicles that have just pssed or the time the vehicles take to stop. According to these values, optimised green times for phases are calculated. Unlike preempion signal, actuated signal only does not take both a train approach and a vehicle on the trap zone (detector 5) into account. However, it does consider the traffic flow on each direction, maximum green time, gap time, and whether a vehicle waits for green light at the next phase.
6. Simulation results
Detailed outputs from the VISSIM simulation, such as vehicle delay, number of stops, vehicle speed, and the number of events that vehicles were on the trap one, were obtained. Delay is an important element that can commonly relate to cost, traffic efficiency, and a level of service. In this study, there are four types of delay presented, namely; average delay time per vehicle, average stopped delay per vehicles, total delay time and total stopped delay on each signal type. As Table 4 shows, a fixed signal creates a relatively greater delay than other signal types, as it does not take the traffic flow into account. On the other hand, both pre-emption with actuated signal and actuated signal only show much less delay. Table 4 also shows that in preemption with actuated signal and actuated signal only, all indicators show an improvement relative to fixed signals.
In terms of safety, the number of an occurrence that vehicles are on the trap zone is significant. When pre-emption does not exist there are five events that vehicles are not able to clear the trap zone before the train approaches the crossing. The pre-emption allows vehicles to be cleared from the trap zone before the train activates the flashing lights, as it reduces the number of the occurrence on the trap to 0. Other indicators also show that pre-emption provides better driving performance for road traffic. It reduces the average delay, the average number of stops, and total travel time 38%, 26%, and 17%, respectively. This leads ultimately to a 22% increase in vehicle speed after pre-emption. In terms of comparisons between pre-emption with actuated signal and actuated signal only, the difference in most indicators is relatively small.
However,in regard to thesignal transition, the pre-emption with actuated signal operation changes the signal time dynamically, on the basis of the number of vehicles approaching the intersection and the train approaching the crossing. In this case study, as shown Table 5, phases 1, 2, 3 and 4 have 25, 23, 8 and 22 seconds in green time, respectively. This means that the use of pre-emption dynamically changes green time which ultimately reduces the cycle time from 100 to 77 seconds.As the analysis time is 3,600 seconds, about 47 frequencies of the cycle time are operated whereas 36 cycles would be observed for the normal fixed signal.
7. Conclusions
Many researchers and practitioners have provided guidelines to ensure a better understanding of what is happening where traffic intersections and railway crossings are located in close proximity. However, such guidelines tend to be too generic for practical use in specific locations.For this reason, a decision is sometimes made by estimating a certain value; or rules-of-thumb that often assume average values. The complex nature of the interactions, such as traffic flow, train frequency, distances between the railway crossing and the intersection and type of vehicles, needs to be considered.
The use of traffic micro-simulation can provide critical indicators to identify traffic phenomenon for each specific environment. Whilst much research has been conducted to provide practical approaches, this paper shows an application of micro-simulation to assess safety and performance at railway crossings. Through the integration of signal controllers and commercially available traffic simulation software, the effect of the pre-emption is evaluated. The developed model is able to be implemented with a small amount of input data. By using traffic simulation, many different scenarios having different traffic flow, train headway and geometry, can be tested. The number of events that vehicles are on the trap zone can be estimated using the proposed model. This tool will assist in determining which safety approach is more efficient for specified traffic and train volumes.Other traffic efficiency indicators, such as travel time and delay are also model outputs. For example, unexpected longer delay might trigger drivers to manoeuvre the vehicle in an aggressive way to compensate for the wasted time. The model may also represent the relationship between safety indicators and the signal transition at the intersection. Increased frequencies of traffic signal cycles, results in a reduction in vehicle delay.
There are, however, a number of questions that remain to be explored in further research for a better understanding of railway safety and performance. As occurrences of vehicle and train conflicts at railway crossings are low compared to road intersection conflicts, there is not enough data to draw definite conclusions. Additionally, the characteristics of railway crossings and road intersections are different in terms of traffic volume, posted speed, and environmental setting. There is a need to use the proposed model in other settings with site specific data needed to be collected. The efficiency of preemption is based on traffic delays along the main road of a single isolated intersection. Pre-emption tends to increase these delays. Appropriate minimum green time should be allocated in order to minimize wasted time for drivers on the road. In general, the results presented here point to several promising applications for future research.
Competing Interests
The authors declare that they have no competing interests.