


1. Introduction
Injury is defined as physical damage caused by an external force. An injury may be classified as non-intentional or intentional [1]. Non-intentional injuries include traffic accidents, falls, collisions, burns, and disasters, and intentional injuries include suicide, violence, abuse, and terror. Injuries have become a major socioeconomic issue in South Korea, as a result of an increased life expectancy and changes in disease patterns and causes of death [2]. Child injuries have a more significant effect on an individual's quality of life, and can cause severe after-effects such as post-injury stress, as well as economic losses related to treatment and care [3]. In Korea, which currently has the lowest fertility rate worldwide, the burdens of the economic costs and suffering caused by these injuries have led to national, rather than merely personal, losses. Nevertheless, child injuries continue to occur in Korea. Although the mortality rate associated with injury accidents among children (i.e., those aged 1–14 years) has decreased from 8.7 per 100,000 individuals in 2005 to 3.9 per 100,000 individuals in 2013, the hospitalization rate among children increased from 881 per 100,000 individuals in 2005 to 897.2 per 100,000 individuals in 2010 [4].
Recently in Korea, additional research attention has been given to injuries overall; however, little attention has been paid to child injuries, except those occurring among elementary school-aged children. Furthermore, few Korean child injury studies have investigated injury mechanisms. Some studies have focused on the conditions and improvement plans regarding safety education in elementary schools [5-8]; additionally, some studies addressed the need for and curriculum of safety education [9,10], whereas others evaluated safety education programs aimed at preventing injury among elementary school students [11,12]. Additional studies addressed slip-down injuries in children's homes [13] or evaluated students’ injuries [14]. As mentioned above, most studies evaluated elementary school children, and most were conducted in the 1990s. Recent studies of injury mechanisms, injury status, and the causes of whole-childhood injury are rare. In addition, injury data sources may have issues with reliability. Each of the previous studies used a different injury dataset: some used the 119 paramedic report, while others used inpatient data from a few hospitals. A National Injury Surveillance System has not yet been established.
This study had two goals: to define the characteristics and mechanisms of child injury, and to determine a more effective primary strategy for improving child safety.
2. Methods
2.1 Target and data collection
Two databases, the National Emergency Department of Information System (NEDIS) and Cheonan Injury Surveillance System (CISS), were used for the analyses in this study. The former was constructed using data from representative emergency medical centers in administrative districts, and the latter comprised data collected from emergency medical centers, fire departments, and education offices in metropolitan and provincial areas.
The differences between the NEDIS and the CISS are listed in Table 1. Since the establishment of emergency medical services regulations, all emergency medical centers have been required to transmit data to the NEDIS. However, the CISS is based on agreements between local governments and local institutions, such as fire departments and emergency medical centers. Each emergency medical center and fire rescue team controls its own data entry. In Cheonan, each fire department and emergency medical center manually records each injury case in the database. The NEDIS, on the other hand, uses an automatic process that features an order communication system. However, both systems include patient information, arrival information, initial evaluation data, medical details, and results from evaluations conducted both upon arrival and after admission.
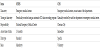
Increasingly, Korean communities have recently implemented their own injury surveillance systems similar to the CISS; however, in the absence of a policy-based commitment from local government, these systems rarely continue to function well after a few years. For this reason, we have mainly used NEDIS data, and used CISS data in a complementary fashion if the NEDIS dataset did not contain appropriate information.
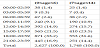
The injury data included deaths recorded for children aged 0-14 years. Patient data recorded in the NEDIS and CISS databases in 2009 and 2013 were analyzed. In the 2009 NEDIS dataset, the 0-6 and 7-14 years age groups comprised 3,407 and 1,343 subjects, respectively, whereas in the 2009 CISS dataset, the corresponding groups comprised 1,193 and 566 subjects, respectively. In the 2013 NEDIS and CISS datasets, the corresponding groups comprised 2,627 subjects and 1,748 subjects, respectively, and 2,443 and 676 subjects, respectively.
The NEDIS serves as both a quality assurance system and medical information database for emergency medical centers. All medical records are immediately uploaded after a patient is admitted to an emergency medical center. The NEDIS was established in 2003 and originally covered 16 emergency medical centers; currently, it has expanded to cover 436 centers. In this study, patient information, including the number of injuries, trends, characteristics, intention, and injury mechanisms, was obtained.
In 2008, the CISS was implemented to collect and analyze injury incidence data. This system has been used to plan and evaluate various injury prevention projects in Cheonan. It provides basic information about the incidence of injury, including severity and death. It also provides performance evaluation data and feedback indicators for injury prevention projects. The collaborators include four tertiary hospitals and the fire department. A total of 40 items are entered into the CISS database, including patient information, medical institution characteristics, inpatient information, emergency medical center evaluation data, patient admittance data, safety gear use, and patient follow up data.
2.2 Data analysis
The International Statistical Classification of Disease and Related Health Problems, 10th revision was used to classify diseases. All data are presented as frequencies and percentages.
3. Results
3.1 Child injury frequencies by sex
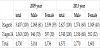
Table 2 presents the numbers of child injury cases and frequencies by sex in the 2009 and 2013 datasets. There were no significant changes in the numbers of injury cases during the study periods; however, the incidence differed by sex. The incidence among male children was higher than that among female children. In addition, male children in the older age group (7-14 years) had a lower injury incidence, compared to those in the younger group (0-6 years). In other words, the injury frequency decreased as the age increased.
3.2 Child injury mechanism
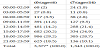
Table 3 lists the mechanisms associated with child injury in the 2009 NEDIS dataset. For the 0–6 years group, the most common injury was a strike force by a person or object (34.1%), followed by a fall/slip (27.3%), cut/puncture from a sharp object (11.6%), burn (4.5%), traffic accident (4.1%), poisoning (1.8%), machine injury (0.12%), and drowning (0.05%). For the 7-14 years group, the same injury mechanism order was observed, although the rates differed. However, the frequency of traffic accidents increased by about 2.5 times as the age increased.
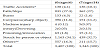
*Traffic Accidents include by car, bicycles, motorcycles, pedestrians, and unspecified
**others: chocking, hanging, sexual violence and electric shock, etc.
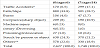
*Traffic Accidents include by car, bicycles, motorcycles, pedestrians, and unspecified
**others: chocking, hanging, sexual violence and electric shock, etc.
3.3 The occurrence time and place of child injuries
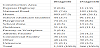
Tables 5 and table 6 list the times of injury occurrence among all children in 2009 and 2013. Regarding daily variations in injury occurrence, the frequency increased gradually from 6:00 to reach a peak between 18:00 and 21:00 (29.0% to 33.2% for 0–6 years, and 28.7% to 31.6% for 7–14 years), followed by a decrease. This pattern reflects the primary times of child activity.
*The total is affected by missing data.
Only the CISS included information about the locations of child injuries. This information, which is intended to help identify the causes of injuries, could be considered an advantage of this regional injury surveillance system.
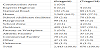
In 2009, the most frequent location of injury among children aged 0–6 years was the home (67.3%). Other places each accounted for less than 10% of the reported accidents. Although the home was also the most frequent location of injury among children aged 7–14 years, the rate was less (26.1%) and was closely followed by national roads (18.2%), school/childcare facilities (16.1%), and outdoor environments (11.1%).
In 2013, the most frequent location of injury for children aged 0–6 years remained the home (64.2%). However, the frequency of injury in outdoor environments increased to 16.7%, much higher than in 2009. Among children aged 7–14 years, the most frequent injury location was outdoor environments (29.1%), in contrast to the home in 2009. This was followed by the home (27.1%), national roads (13.2%), and school/childcare facilities (10.4%).
Although the home was the most frequent location where injuries occurred, increasing age led to the increased diversification of activities and, consequently, of the locations of injury occurrence.
4. Discussion
To decrease the incidence of child injuries, we must identify the causes, which are complex and varied; accordingly, specialized studies of injury mechanisms are needed. To date, no such studies of child injuries have been conducted, and the present study was performed to address this lack. We observed the following points.
First, the frequency of injury among children is closely associated with the sex. Male children were more likely than female children to incur injuries.
Second, the most common cause of child injury was a strike force from a person or object or a fall/slip. A cut/puncture from a sharp object and traffic accident were ranked 3rd and 4th, respectively, among young children, whereas this order was reversed among older children. The frequency of injuries caused by traffic accidents increased with increasing age.
Third, the frequency of child injury increased incrementally from 6:00 to a peak at 18:00–21:00.
Fourth, child injuries most frequently occurred in the home, although increasing age led to a wider range of activities and increasing frequencies of injuries at schools/childcare facilities, in outdoor environments, and on national roads.
Fifth, the finding that the CISS database provided diverse information about the locations of injury occurrence suggests that local injury surveillance systems can collect regionally significant data within community environments that would have been missed by NEDIS.
As members of society, children have the right to health during growth and development. Therefore, child injuries should be prevented. Generally, injury accidents can be prevented in one of two ways. The first involves the improvement of environmental factors in which accidents can occur; the second involves changes to the human behaviors that can cause accidents through education, and particularly safety education. The first way requires active and policy strategies to prevent child injury, whereas the second, a passive strategy, requires interventions by parents, school teachers, and child care providers. In particular, parental commitment is a primary factor in this passive strategy. Parents should have a basic knowledge of child safety. Additionally, they should monitor the environments in which their children are active, and instruct their children not to engage in dangerous activities. The provision of preventive guidance to parents will benefit children and result in less child mortality. In other words, active parental engagement in child injury prevention can be a fundamental strategy for reducing child injuries.
4.1 What was already known about this subject
- Traffic accidents are the most common mechanisms of injury among elementary school children and adolescents. The second most common mechanisms are pedestrian accidents among elementary school children, and drowning and burns among adolescents.
- The importance of safety education in schools has been emphasized, leading to the recent establishment of safety education standards and introduction of educational programs. However, these have not been fully applied in schools.
- Various types of injury surveillance systems exist and operate in various ways, and these systems have been utilized by injury prevention programs that collect and analyze data.
4.2 What this study adds
- The most common mechanism of injury among the children aged 0–14 years were a strike force by a person/object or a fall/ slip.
- The most common location of child injury occurrence was the home.
- Parental commitment is a fundamental strategy for preventing injury. Therefore, sufficient education and child safety-related programs should be developed for parents.
- A unified child injury surveillance system is needed. This was underscored by the use of slightly different data forms by NEDIS and CISS.
5. Conclusion
This paper described the types and characteristics of child injuries. These results suggest the need to educate school teachers about safety, to promote parental involvement in school safety programs, and encourage parental observation and concern at home. However, as shown in this paper, various types of injury surveillance systems operate in various ways, which limits comparisons of data regarding child injuries from different sources. In the future, a unified child injury surveillance system should be constructed and used to manage injury data.
Competing Interests
The authors declare that they have no competing interests.