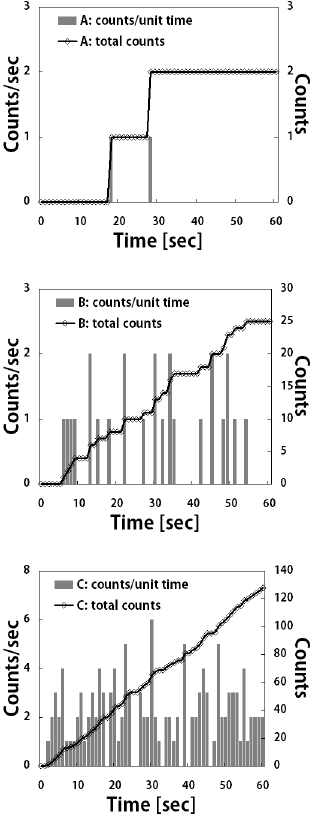
Figure 8: The progress of count in the phantom II acquisition by unit time and the progress of the count sum data for points A, B, and C (shown in Figure 7).
The left longitudinal axis represents the count per second, and the right longitudinal axis shows the count. The transverse axis denotes the time (s).
The left longitudinal axis represents the count per second, and the right longitudinal axis shows the count. The transverse axis denotes the time (s).