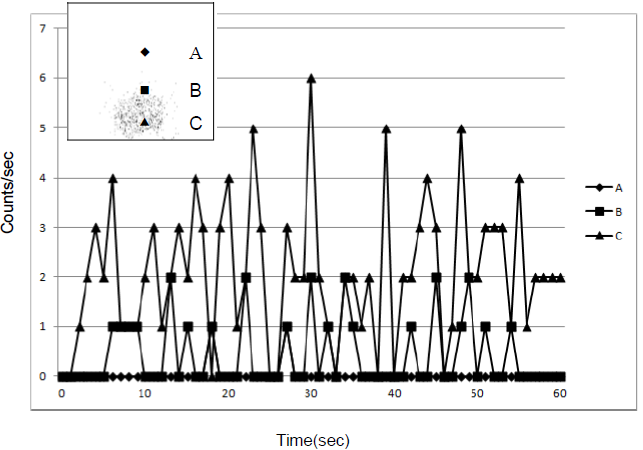
Figure 7: The count-data pattern stores matrices A, B, and C of Phantom II and shows the unit time series variation by acquisition. (Phantom image of 1-s acquisition).
The y-axis represents the count per second, and the x-axis denotes time (s).
The y-axis represents the count per second, and the x-axis denotes time (s).