


Summary
The purpose of this study was to compare automated method results of test strips, microscopic analysis and counts with the manual methods, using urine samples (n=275) analyzed by iQ200®. White and red blood cells (WBC/RBC) counts by iQ200® were compared with manual methods (Neubauer and KCell). Leukocyte esterase and hemoglobin detection provided by the test strips were also analyzed. We suggest that automated methods, such as iQ200®, seems to be a reliable tool for urinalysis in daily clinical practice, but the distinction between isomorphic and dysmorphic RBC, casts and crystals identification still depend on microscopic examination.
1. Introduction
Renal diseases are an important public health problem worldwide. Early recognition and management of these diseases are considered good strategies to reduce the progression to end-stage renal disease (ESRD) and, consequently, the number of chronic kidney disease (CKD) patients undergoing renal replacement therapy [1-5].
The Kidney Early Evaluation Program (KEEP®) recommends the use of urinalysis in daily clinical settings and underlines the importance of detecting hematuria and proteinuria as primary signs of kidney disease. Furthermore, the evaluation of urinary erythrocyte morphology has been considered crucial to differentiate a glomerular from a non-glomerular disease [6,7].
The symptoms caused by renal or lower urogenital tract pathologies have many similarities, which reinforce urinalysis is a valuable tool for the initial evaluation of the genitourinary system. In addition, despite of probably being one of the most ancient diagnostic tests used in medicine, urine examination continues to be an attractive option to obtain information on corporal homeostasis by means of a quick and easy collecting method. Urinalysis by manual method, using standard volume of urine and several types of chamber to count urinary elements, has been performed in many clinical. More recently, the burden of urinary specimens begs for automation and recent technological advances have turned the automated urine testing a reliable tool that has reduced the execution time for the analysis[8-10].
Whereas both the manual and automation methods have advantages and disadvantages, the present study sought to compare the results obtained by using automated urinalysis (iQ200®) and manual methods (Neubauer Chamber and K-Cell® Blades) in order to analyze counts as well as the ability to detect and identify urinary elements for the purpose of aid in the diagnosis of renal diseases.
2. Material and Methods
Two hundred seventy-five urine specimens obtained from patients (n= 275; age: 46.5±18.7 years; 215 (78.2%) females) at the Diagnosis Support Unit of the Hospital de Clinicas, Universidade Federal do Paraná (UAD-HC / UFPR) were analyzed in the period from April to June 2014. The samples were analyzed by equipment I-Chem® Velocity (IQ200®), manufactured by IRIS Diagnostics (Division of International Remote Imaging Systems, Inc. USA). IQ200® consists of two automated units, being one unit to the physical and biochemical parameters evaluation (test strips) and the other for the detection and counting of urinary elements.
Urine samples were analyzed within 2 hours after collection. After homogenization and aspiration of an aliquot of 1 ml, samples were placed between two sheets forming a fluid layer, which is under a microscope coupled to a video camera charged coupling device (CCD) that captured 500 frames per sample. The images were sent to the analytical unit of the computer. The particles were isolated and analyzed by Auto Particle Recognition (APR®), neural network software which classifies the particles prepared using size, texture, contrast and shape into 12 distinct categories: white blood cells (WBC), red blood cells (RBC), WBC aggregates, hyaline casts (without inclusions), casts not classified (with inclusions), epithelial cell sloughing, non-squamous epithelial cells, bacteria, fungi, mucus, sperm and crystals. The operator can edit the results by reviewing images. The quantification of particles was calculated from the number found in the volume analyzed [11,12]. The urinary elements were analyzed and confirmed in the screen of iQ200® by experienced professionals. Then, when the screen shows elements called "unclassified", the final classification was performed from the evaluation of the observed images. And, when necessary it was checked by optical microscopic analysis.
Selected samples were analyzed by the manual microscopic analysis using a Neubauer Chamber and K-Cell® Blade without centrifugation, as recommended by the European Urinalysis Guidelines (EUG) for studies comparing manual and automated methodologies in urinalysis [13].
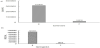
The Neubauer Chamber has delimited areas used for cell count. The depth between the bottom surface of the cover glass that sits on elevated rails and the enclosed area is 0.1mm. The delimited area is a square of side 3 mm, divided into 9 large squares with each side of 1 mm. The four quadrants of WBC were used and the value obtained was multiplied by 2,500 to obtain the value of cell per ml. Counts were performed in duplicate and the average of the counts of each sample was used for statistical analysis. K-Cell® Blade has 10 wells and each well has two sets of nine circles. The volume of each circle corresponds to 0.011uL and the set of 9 circles corresponds to the total volume of 0.1ul. The result of cell count was multiplied by 10,000 to obtain the value of cell per ml. Counts were performed in duplicate and the average of the counts of each sample was used for statistical analysis, Figure 1 [14,15].
This study was submitted and approved by the Ethics Committee and Research Health Sector UFPR under number 15230113.5.0000.0102 (CAAE) and by the co-participant Institution (Hospital de Clinicas/ UFPR) issued the number 361 880.
Statistical analysis was performed using Statistica10® (Statsoft) as analysis of variance (ANOVA) randomized model, Z test for two proportions to mutually exclusive categories and analysis of regression and correlation "Pearson".
3. Results
The WBC count per ml by iQ200® device was compared with the presence of the leukocyte esterase test strip. Positive esterase test was observed in 59.6% (n=164) and the results obtained by IQ200® in these samples presented 315,800±608,413 WBC per ml. Negative esterase was observed in 40.4% (n=111) and presented 24,838±34,152 WBC per ml (p<0.001), Figure 2.
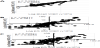
Regarding the presence of hemoglobin in the test strip, 82 samples showed positive reaction (29.8%) and 193 showed negative reaction (70.2%). When comparing the presence of hemoglobin in the test strip in relation to the RBC count by IQ200®, the negative samples presented 26,316±46,424 RBC per ml and positive samples presented 1,275,537±7,394,959 RBC per ml (p=0.019), Figure 3.
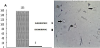
Regarding RBC morphology, the automated method detected 159 samples with RBC, being 155 (97.5%) with isomorphic morphological pattern and 4 (2.5%) considered "unclassified". The images provided by IQ200® were not sharp enough to reclassify. Thus, "unclassified samples" were analyzed by optical microscopy. RBC from these samples was dysmorphic, Figure 4.
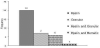
The iQ200® equipment identified the presence of 33 samples with urinary casts which were classified as hyaline or no inclusions 36.4% (n=12) or other casts with inclusions 63.6% (n=21). The casts were reclassified based on the images provided by iQ200®: hyaline casts were present in 21 samples (64%), granular casts in 6 (18%) and hyaline and granular casts in 6 (18%). A similar result was obtained by optical microscopy analyses: hyaline casts were observed in 20 samples (59%), granular casts in 07 (21%) and hyaline and granular casts in 06 (18%). Importantly, hyaline and RBC casts (3%) was detected in only one sample by optical microscopy and not by the iQ200®, Figure 5.
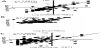
Table 1 show the WBC and RBC counts by three methods used in the study. Despite the significant difference in maximum scores, the confidence interval (CI) was the same in both manual methods except by equipment which many more cells are counted.
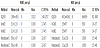
The comparison of WBC count between Neubauer Chamber and K-cell® Blade presented a random error of 13.11% and a systematic error of 0.16% (R2=0.87). The comparison of WBC count between KCell® and iQ200® showed random error of 51.89% and a systematic error of 9.3% (R2=0.48). This comparison showed that the values found in iQ200® were on average 1.6 times higher and the correlation between the two methodologies decreases when the values were above 1500/μl. Comparison of WBC count between Neubauer and IQ200® showed random error of 39.47% and a systematic error of 6.1% (R2=0.60). The iQ200® counts were on average 1.6 times higher and the correlation between the two methodologies decreases when the values were above 1000/μl.
The comparison of RBC count between the two methodologies Neubauer and K-Cell® demonstrated that both are equivalent, presenting a casual error of 25% and systematic error of 11% (R2=0.7548). The comparison of the RBC count between K-Cell®and iQ200® showed a random error of 21% and a systematic error of 2% (R2=0.7897). This comparison showed values on average 1.16 times higher in iQ200®. The comparison of the RBC count between Neubauer and iQ200® presented a random error of 43% and a systematic error of 18% (R2=0.5736). This comparison showed values on average 2.75 times higher in iQ200®.
4. Discussion
This study compared three different methods of urine analysis in an attempt to verify the advantages and disadvantages of each method. Regarding automated test strip analysis, it was compared the results in the leukocyte esterase test. Comparing the positive results and counts by equipment, it was possible to demonstrate the low frequency of false-positive results in the test strip. The main causes of falsepositive results include oxidizing agents, reaction with the nuclei of epithelial cells and the use of drugs such as imipenem, meropenem and clavulanate [16,17].
Comparing the negative results of leukocyte esterase and the WBC count by equipment, the negative samples had a mean of 24,838 WBC per mL iQ200®. This result could show low sensitivity to values considered significant (> 10,000/ml). The sensitivity of the test described by the equipment manufacturer provides information of a detection threshold for the presence of the esterase from counts above 25,000 WBC per ml [11]. Therefore, the equipment detects within the proposed linearity, but above the levels considered significant for WBC. The test is based in the presence of the enzyme esterase in the urine, which occurs after cell lyses not only due to infectious processes, but also due to low urinary density or alkaline pH. According to Skitek (2004), a false negative result may occur in poorly preserved samples or when analyzed after 2 hours of collection [18]. The main factors that may lead to a false negative results are: high levels of glucose and proteins, yellow pigment, crenation due to high density of WBC that prevents the release of esterases or drugs and chemicals such as ascorbic acid, oxalic acid, cephalexin, cephalothin, gentamicin, and tetracycline [19,20].
Some authors have demonstrated considerable heterogeneity in the accuracy of test strip [9,10,21,22]. A negative test strip is not necessarily indicative of WBC counts below the reference value, as confirmed by our data. As so, the analysis of WBC should be performed by microscopic or by automated methods even in samples that tested negative for the presence of leukocyte esterase. Automated systems have been developed to screen urines in order to eliminate those in which a culture is highly unlikely to yield clinically relevant results. These systems have recently added the detection of a specific parameter “small particles”, which has been added to improve the sensitive of the assay. However, the addition of this parameter did not add any benefit to results obtained by traditional measures, especially WBCs, in identifying urines for which a culture should be performed [10,23]. Then, considering also that test strip has low sensitivity in samples with few WBCs count (<25,000/ml), we do not recommend the isolated use of just one of the methods commented as a screening for urine culture.
Regarding the detection of hemoglobin by the test strip, the difference found can be explained by the methodology used by manufacturers of test strips, which is based on the pseudoperoxidase activity of the heme radical present in hemoglobin [24]. If there is no free hemoglobin molecule, the chemical reaction may be negative, even when RBCs are present in the urine sample. Whereas RBC counts above 5,000 cells per ml are clinically significant, our results showed that it is not possible to rely only on the test strip. However, the isolated use of microscopy shows the limitation of not detecting “ghosts” (when only the RBC membrane is faintly visible due to the hemolysis) arising from samples with free hemoglobin produced by hemolytic disorders or by lysis of RBC in the urinary tract. Our study highlights the importance of concomitant use of chemical and microscopic analysis to evaluate the presence of blood in the urine. The chemical test strip determines the presence of free hemoglobin and the microscopic method confirms the presence of the RBC that do not reacted in the test strip since they are intact and allows the identification of dysmorphic RBC.
In devices using flow cytometer, the RBC can be confused with yeast, since this method uses laser beams that identify the cell as the size or shape of the generated pulse [25]. Altekin and colleagues (2010) reported impaired RBC quantification due to the influence of particles as yeast, oxalate crystals or bacteria [26]. In our study, there was no false-positive result for RBC when yeasts were present, suggesting the correct identification of these elements by the imaging system.
Our study seeks to contribute to assess the use of automation in urinalysis as a diagnostic aid in glomerular diseases. Currently, urinalysis flow cytometer supplies through impedance histograms with data on the volume of RBC, allowing prior information of likely morphological changes arising from the passage of RBC by glomerular capillaries [27,28,29]. The iQ200® usually recognizes and classifies the isomorphic RBC, but does not classify dysmorphic RBC, only relates to “unclassified” [30,12]. Boven et al. (2012) compared the use of iQ200®with phase contrast microscopy (n=207) in patients with suspected dysmorphism. The iQ200® showed enough images for classification of D1 and D2 cells, but was not sufficient to classify D3 cell forms (D1/D2 are acanthocyts with lesser or greater loss of cytoplasmic staining and D3 represent all other forms of cell deformity), emphasizing the importance of using the microscope for a more detailed study [31].
In our study, it was detected 159 samples with RBC, 155 with isomorphic morphological pattern and 4 considered "unclassified". The presence of dysmorphic RBC was confirmed in the screen, but the distinction between the dysmorphic forms was not possible. The samples "unclassified" were confirmed by optical microscopy according to the technique described by Barros Silva et al. [32]. This finding reaffirmed the importance of reviewing the urine sample by optical microscopy when the "unclassified" message is released.
While the iQ200® recognizes casts through images, flow cytometer system regards the laser deviation as the particle size, each output signal is converted by the equipment software and plotted on a graph as small particles (RBC, WBC and others) and larger particles (casts and epithelial cells). But also does not differentiate between different casts [25,7]. In our study, the results for automated and microscopic analyses were similar. The presence of hyaline casts detected by iQ200® was confirmed by microscopy. Even though the equipment image evaluation had been provided, it was not possible to identify the morphological characteristics and the microscopic evaluation was necessary whenever “unclassified” casts were detected. Another important situation was the finding of RBC casts by microscopy not reported by iQ200® images. This occurred only in one sample, a fact perhaps explained by heterogeneity of urine samples that constitute a true colloidal solution, so it may be that the volume aspirated by iQ200 not presents such casts. This can also occur in the manual microscopic analysis by centrifugation errors, as reported by Ito et al. [33].
Considering that urinary casts are important findings in renal diseases, the correct identification of RBC, WBC, waxy or fatty casts, are important to assist in the diagnosis of glomerulonephritis, pyelonephritis, nephrotic syndrome or even to indicate the severity of a kidney disease [34-38]. So, the distinction between the righteous isomorphic and dysmorphic RBC, casts and crystals identification still remain dependent on microscopic examination, as well as the presence of rare or unusual elements such as Trichomonas vaginalis, Pthirus pubis, Enterobius vermicularis eggs and others. In this context, training and professional experience are crucial for the quality of the analysis.
The comparison between WBC/RBC counts by Neubauer Chamber and Kcell® Blade showed similar results between the two methods. The comparison between manual analysis and iQ200®, showed higher counts by the equipment, a fact that occurs due to the increased number of cells counted by automated systems. Other studies also reported higher results in automated systems such as iQ200® [39,30].
Although the amount of WBC in urine is not directly related to the intensity of infectious processes, values above 10,000 per ml are considered significant and when massive WBC per ml is found, it may be related to pyelonephritis and WBC casts are common findings. Furthermore, the correct quantification of RBC in urine is important because is directly proportional to the intensity lesion in pathologies that affect the urinary system, especially to check the progression of lesions [40].
Although the laboratory results should only be compared if used the same method as manual (Neubauer, KCell or others) or as automated (optical or flow cytometers), in our study the cell counts showed an acceptable variation in the methods used that does not exclude the reliability of the result. The iQ200® proved to be a useful tool in urinalysis providing results quickly and securely, to improve the flow of samples in the routine and not depend on previous sample preparation. However, the identification of certain urinary elements requires microscopic review. KCell® Blade seems to be a good alternative to manual urinalysis, as demonstrated by the good correlation with Neubauer chamber, a higher velocity analysis and provides a quantitative result per ml. It has been recognized that the manual counts are less accurate because of low number of cells is counted and of beeing operator dependent. Otherwise, it has been reported automated system inability to correctly identify all the elements present in urine sediment such as dismorphic RBC, yeast, oval crystals of calcium oxalate, degenerated cells and mucus cells grouped [41,26,39].
Urinalysis is an important tool in screening and detecting urinary elements found in the urogenital system diseases that must be performed judiciously and with standard techniques. We suggest that the implementation of automated devices, such as iQ200®, in urinalysis should be carefully evaluated taking into account the population to be served, the volume of the analysis performed, the availability of skilled professionals and the relation cost/benefit, without losing focus on the quality of the laboratory result.
Competing Interests
The authors declare that they have no competing interests.
Author Contributions
Nicola Daniele, Fulvia Fraticelli and Silvia Franceschilli, contributed in draſting the manuscript. Francesco Zinno, contributed in draſting and reviewing the manuscript.