


1. Introduction
Researchers of the consequences of strong and catastrophic earthquakes prove that the surface sedimentary layer can significantly increase the amplitudes of surface seismic waves, which can cause further destruction [1,2]. Determining the influence of the geological environment on seismic waves, in this sense, is an important component of the micro-zoning of areas with moderate and high seismic activity.
The most commonly used method of a wide range of developed methods [3-6] for estimating the amplitude-frequency characteristics of the surface layer is the method of H/V spectral relations (Nakamura method).
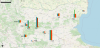
The aim of the present study is to assess and analyze the amplitudefrequency composition of microseismic oscillations and their possible seasonal variations in the territory of the seismic network NOTSSI (National Operating Telemetry System for Seismological Information (Figure 1)) with the method of spectral relations (H/V).

2. Method
To estimate the amplitude-frequency composition of the microseismic signal and the possible seasonal variations according to the data from the seismic stations, the method of the spectral relations of the vertical and horizontal components of the microseismic oscillations (H/V Nakamura) was applied. This technique was first proposed by Nogoshi M. and later popularized by Nakamura Y. [7]. The method is effectively used both for determining the fundamental frequencies and for determining the corresponding oscillation amplification. The spectra of microseismic fluctuations and H/V ratios were calculated using the Geopsy program (http://www.geopsy.org/). To avoid accidental errors caused by near and far earthquakes, explosions and man-made noise, time intervals of 24 hours are selected. For these time intervals, several hundred to fifteen hundred time windows (60 s long) were selected in order to avoid accidental noises in the analyzed records. The resulting H/V ratio curves and the corresponding values of the standard deviations were obtained by averaging the individual H/V ratios for all windows. The standard deviations of the H/V curves are calculated from the arithmetic mean of the logarithms of all individual H/V curves for all windows.
3. Data
24-hour seismic records from five different days for each season were analyzed as follows: winter - from 13 to 17.01.2018; spring - from 13 to 17.04.2018; summer - from 13 to 17.07.2018 and autumn - from 13 to 17.10.2018. Each of the 24 hour records is divided into 60 second windows (from 100 to 1500 windows), out of which are selecting the windows with the lowest level of seismic noise. The H/V spectral ratio curves for each season were obtained after averaging the average curves for each of the 5 days of the given season.
4. Results
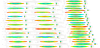
As a result, the H/V curves characterizing the amplitude-frequency composition of the microseismic noise (Figure 2a) were obtained for 11 seismic stations from the NOTSSI network, for each season (Figure 2b). Taking into account the peculiarities of the recording equipment, the spectral characteristics in the frequency range from 0.5 to 20 Hz have been reliably determined. The criteria developed in the SESAME project were used to verification the reliability of the obtained results (https://www.uni-potsdam.de/sesam/index.php):
where f0 - frequency of the amplitude peak of H/V; lW - length of the time window; nc= lWnWf0; nW - number of windows for the average curve of H/V; σA(f) - standard deviation of the amplitude AH/V(f); f - current frequency.
According to the type of the obtained curves of the spectral H/V ratio, the studied seismic stations can be divided into two groups. The first group may include the seismic stations VTS1, PSN, PRD, PLD, MMB and KDZ, which have stable amplitude-frequency characteristics of the microseismic signal regardless of the season. In general, the curves of the first group are easy to interpret and represent smooth curves slightly complicated by extremums of relatively small amplitude. For some of the stations (MMB, PRD, VTS1) relatively wide smooth extremes of medium and low (KDZ, PLD) frequencies are observed.
The second group includes stations for which the obtained curves of the spectral H/V ratio have significant seasonal variations: KKB, PGB, PLN, SZK, TRAN. The nature of the seasonal variations for the different stations differs considerably. For a PGB station for the 8-17 Hz frequency range, the H/V curves for the spring and at most for the summer period significantly exceed the levels of the curves for the winter and autumn periods.
In Figure 3 and Figure 4 presents the values of resonant frequency (f0) and amplification factor A0 (f0) for each season.

5. Conclusion
The level of the curves for the spring, summer and autumn period significantly exceeds the level of the curve for the winter period at frequencies from 0.2 to 8 Hz for the KKB station. For the PLN station, the spring curve exceeds the levels for the other seasons for almost the entire frequency range. The H/V curve for the spring period is significantly lower than the levels for the winter, summer and autumn periods.
The analysis of the spectral H/V ratio for the stations of the second group shows an increase in the amplitudes of the horizontal oscillations relative to the vertical ones in the summer period. This increase may be related to the change in the wave composition of microseisms depending on seasonal and technogenic conditions. In general, the overall increase in the amplitudes of the H/V spectral ratio during the spring and summer periods can be explained by the melting of snow and most precipitation compared to other periods [8].
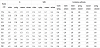
Table 1 presents the calculated resonant frequencies f0 and the amplitudes of the H/V spectral ratio of these frequencies A0 (f0) for the individual seasons, as well as the correlation coefficients of the H/V ratio between the different seasons.
Competing Interests
The authors declare that they have no competing interests. The author declare that there is no competing interests regarding the publication of this article.
Acknowledgments
This work has been carried out in the framework of the National Science Program "Environmental Protection and Reduction of Risks of Adverse Events and Natural Disasters", approved by the Resolution of the Council of Ministers No 577/17.08.2018 and supported by the Ministry of Education and Science (MES) of Bulgaria (Agreement No Д01-363/17.12.2020); Presentation of this work is supported by the National Scientific Program "Young Scientists and Postdoctoral Fellows", approved by Council of Ministers Decision No 577 / 17.08.2018 and supported by the Ministry of Education and Science (MES) of Bulgaria.
References
- Borcherdt RD (1970) Effects of local geology on ground motion near San Francis-co Bay. Bulletin of the Seismological Society of America 60: 29-61. [CrossRef] [Google Scholar]
- Borcherdt RD, Glassmoyer G (1992) On the characteristics of loсal geology and their influence on ground motions generated by the Loma Prieta earthquake in the San Francisco Bay region, California. Bulletin of the Seismological Society of America 82: 603-641. [CrossRef] [Google Scholar]
- Andrews DJ (1986) Objective determination of source parameters and similarity of earthquakes of different sizes. Earthquake Source Mechanics. [CrossRef] [Google Scholar]
- Field EH, Jacob KH (1993) The theoretical response of sedimentary layers to ambient seismic noise. Geophysical Research Letters 20: 2925-2928. [CrossRef] [Google Scholar]
- Lermo JF, Chavez-Garcia FJ (1994) Are microtremors useful in site response evaluation? Bulletin of the Seismological Society of America 84: 1350-1364. [CrossRef] [Google Scholar]
- Drouet S, Chevrot S, Cotton F, Souriau A (2008) Simultaneous Inversion of Source Spectra, Attenuation Parameters, and Site Responses: Application to the Data of the French Accelerometric Network. Bulletin of the Seismological Society of America 98: 198-219. [CrossRef] [Google Scholar]
- Nakamura Y (1989) A method for dynamic characteristics estimation of subsurface using microtremor on the ground surface. Quarterly Report of Railway Technical Research Institute 30: 25-33. [Google Scholar]
- Drennov AF, Dzhurik VI, Serebrennikov SP, Drennova NN (2011) Influence of the upper section on the amplitude-frequency content of a seismic signal by the example of seismic stations in Pribaikalye and Transbaikal area. Seis-micheskie pribory 46: 15-25. [CrossRef] [Google Scholar]