


1. Introduction
Land surface albedo is the ratio of the diffuse reflection of solar radiation to the total solar radiation received by a surface [1,2], which characterizes the reflectivity of the land surface and quantifies the distribution of radiation between the ground and atmosphere [3,4]. As an essential climate variable, it will affect the energy balance of the earth-atmosphere system, even if there is a subtle change [5,6]. Therefore, it is one of the important parameters for the balance of surface radiation energy [7], which can be used for climate monitoring [8] and land cover change research [9]. Significant changes in surface albedo accompany variations in land cover, which are disturbed by natural processes (snowfall and changes in solar illumination) and human activities (deforestation, reforestation, urbanization and shifting cultivation) [10], and they also indicate environmental vulnerability [11-14]. Consequently, long-term records on surface albedo are necessary for further understanding regional even global land cover processes and evaluating the surface radiation budget to monitor the variation of the natural environment [15,16]. In addition, they are required for hydrological, biogeochemical and climate modeling and weather forecasting research [17,18]. Studies suggest that climate change and human activities inevitably have an effect on cropping patterns and the physiology of plants [19,20]. Furthermore, as the canopy and height of crops in different growth periods change greatly and regularly, accordingly, the surface albedo of farmland changes regularly [21]. However, there is not much research on the surface albedo characteristics of farmland.
Remote sensing has the capability of providing consistent estimates of albedo at regular temporal intervals [22]. With the development of satellite observation and information processing technologies, the use of remote sensing technology to obtain the albedo has been widely used [23]. In recent years, a series of albedo products have been produced, such as MISR (Multi-angle Imaging Spectroradiometer) albedo product [24], AVHRR (Advanced Very High Resolution Radiometer) global albedo product [25], MODIS (Moderateresolution Imaging Spectroradiometer) albedo product [26], and GLASS (Global Land Surface Satellite) albedo product [27]. As a result of technical constraints, it is difficult to find data with both high spatial and temporal resolution [28-32]. Additionally, cloud contamination and spatial-temporal absence remain sources of uncertainty in the retrieval of albedo data [33,34]. The albedo products with a coarse spatial resolution, mentioned above, cannot effectively reflect the spatial and temporal change in farmland with a high heterogeneity [35]. Albedo products with a high spatial resolution, such as Landsat data, can monitor the changes of land cover at a landscape scale [36-39], but its 16-day revisit-cycle and cloud contamination limit the frequency of observation [40], especially in the growth season, when the crops grow rapidly. Under this condition, generating longtime series of albedo products with both a high temporal and spatial resolution, especially in croplands, is important.
One way to solve the problem is data fusion [41-45]. There are many examples of fusing data, and the spatial and temporal adaptive reflectance fusion model (STARFM), proposed by Gao in 2006 [44], is a widely used downscaling method. STARFM has the capability of combining the advantages of the high temporal resolution of MODIS imageries and high spatial resolution of Landsat scenes to generate predictive images with Landsat’s spatial resolution and MODIS’s temporal resolution [46]. It has been used to research the downscaling of land surface reflectance [47], Leaf Area Index (LAI) [48] and Normalized Difference Vegetation Index (NDVI) [49,50] with some improvement, achieving preferable results. Therefore, this paper studies the downscaling of land surface albedo in Hengshui using the STARFM algorithm and applies it to obtain long-time series of land surface albedo product. Moreover, we explore spatial-temporal variation of the surface albedo over the study area.
In this paper, the basic processes are: (i) generate synthetic images by the STARFM algorithm, (ii) access the quality of synthetic images by comparing them with the albedo directly retrieved from Landsat images, which are almost cloud-free, and (iii) analyze the spatialtemporal variation in Hengshui during the study period. Results of this study indicated that STARFM algorithm is applicable in generating time series high resolution land surface albedo and the synthetic predictionhas capability to reveal the spatial-temporal variation of surface albedo.
2. Materials and Methods
2.1 Study area
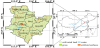
Hengshui (37.05°N-38.38°N, 115.17°E-116.57°E), is located in the alluvial plain of Hebei province in China, with an elevation of 12- 30m, and covers a land area of about 8815 km2. The climate in the study area is a temperate continental monsoon climate, with four distinct seasons. It is cold and dry in winter, while hot and rainy in summer. The frost-free period is about 200 days a year. Over the years, the average precipitation is 522.5 mm. Hengshui is composed of 11 counties, when considering the political functions (Figure 1).
The total area of crops accounts for more than 80% of the land in Hengshui. It is an essential region of cotton production for Hebei province and provides agricultural production processing and supply for Beijing and Tianjin. Cotton plantations cover more land area than any other profit crops, with around 1300 km2, while the winter wheat is the predominant cultivated crop, with about 5850 km2 in the regions of Hengshui. Double cropping of winter wheat and summer maize and annual cotton without crop rotation are main crops planting performances over the study area. The majority of the cotton plantations are covered with a plastic film to increase crop yields. As a typical agricultural area in North China, Hengshui is an appropriate place to study the variation of albedo in farmland.
The total area of crops accounts for more than 80% of the land in Hengshui. It is an essential region of cotton production for Hebei province and provides agricultural production processing and supply for Beijing and Tianjin. Cotton plantations cover more land area than any other profit crops, with around 1300 km2, while the winter wheat is the predominant cultivated crop, with about 5850 km2 in the regions of Hengshui. Double cropping of winter wheat and summer maize and annual cotton without crop rotation are main crops planting performances over the study area. The majority of the cotton plantations are covered with a plastic film to increase crop yields. As a typical agricultural area in North China, Hengshui is an appropriate place to study the variation of albedo in farmland.
2.2 Data and data processing
2.2.1 Landsat reflectance data
Landsat data between 2001 and 2015 are acquired through the Landsat data gateway of United States Geological Survey’s (USGS) Land Product Characterization System (LPCS) (https://lpcsexplorer.cr.usgs.gov/). Images are atmospherically corrected and radiometrically normalized using the Landsat Ecosystem Disturbance Adaptive Processing System (LEDAPS) [51]. The Landsat surface reflectance has a spatial resolution of 30m and a temporal resolution of 16 days, and the study area is in the Landsat WRS-2 path123/ row034 of the Worldwide Reference System (WRS). Extensive pixel quality information is also included. Based on the Landsat launch time and quality of the remote sensing images, we downloaded Landsat-7 Enhanced Thematic Mapper Plus (ETM+) data for 2001 and 2002, Landsat-5 Thematic Mapper (TM) data for 2003-2011, and Landsat-8 Operational Land Imager (OLI) data for 2013-2015, and there are no valid data for 2012. All these data are cloud free. The products are mapped in the World Geodetic System (WGS) 84 datum and Universal Transverse Mercator (UTM) projection. The dates of Landsat data used in this study are shown in Table 1.

2.2.2 Global land surface satellite (GLASS) albedo data
Global Land Surface Satellite (GLASS) is a dataset of a long-time series, high-temporal resolution and high-quality, containing the leaf area index (LAI), albedo, emissivity (EMT), etc. The coverage time of albedo product is from 1981, where the product of 1981-2000 was generated from AVHRR data, with a spatial resolution of 0.05°*0.05°, using equal latitude projection, and the subsequent product was generated by MODIS data, with a spatial resolution of 1km and sinusoidal projection. The GLASS albedo dataset is a fusion product of the Angular Bin (AB) algorithm and Statistics-based Temporal Filtering (STF) algorithm. There are 4 kinds of products based on MODIS data: GLASS02A21 and GLASS02A22 are generated using the AB1 algorithm, while GLASS02A23 and GLASS02A24 are generated with the AB2 algorithm. The 4 middle products are combined to produce the end-level product with the STF algorithm [52]. GLASS black-sky and white-sky albedo products from 2001 to 2005 are acquired, with a spatial resolution of 1km and temporal resolution of 8 days.
2.2.3 MODIS snow cover data
MOD10A2 data is accessible from the National Snow and Ice Data Center (NSIDC) (https://nsidc.org/). It provides 8-day maximum snow cover extent in 1200 km ×1200 km tiles at a spatial resolution of 500m. In the data set, snow cover is derived from the Normalized Difference Snow Index (NDSI). Typically, the snow covered land has high reflectance in visible bands while low reflectance in shortwave infrared. The NDSI takes advantages of the spectral difference to distinguish snow from surrounding features even clouds. The maximum snow extent represents snow that was observed on at least one day over an 8-day period. With the help of MOD10A2, we can understand the impact of snowfall and snowmelt events on surface albedo variations in winter.
2.2.4 GlobeLand30 data
The 30-meter Global Land Cover Dataset (GlobeLand 30- 2000/2010) (https://www.globallandcover.com), which consists of 10 land cover types, including cultivated land, grass, water and artificial surfaces, was used in this paper [53]. This dataset covers land area from 80°N to 80°S with a spatial resolution of 30m and the data resources used for data generation are mainly 30m multispectral images, including Landsat TM and ETM+ images and scenes of Chinese Environment Disaster Alleviation Satellite (HJ-1). The overall accuracy of GlobeLand30-2010 reaches 83.51% and the Kappa indicator is 0.78.
2.3 Methods
2.3.1 Albedo retrieval from landsat data and GLASS data
The broadband Landsat albedo is retrieved by a direct-estimation algorithm, which build an empirical relationship between the land surface directional reflectance and broadband albedo at local solar noon [54].Considering the Landsat reflectance is derived from the single-viewing angle, the Polarization and Directionality of Earth Reflectance-3(POLDER-3)/ Polarization and Anisotropy of Reflectances for Atmospheric Sciences coupled with Observations from a Lidar bidirectional reflectance distribution function(BRDF) Database (POLDER-3/ PARASOL BRDF) is an ideal anisotropy reflectance dataset to compute the broadband albedo for establishing the regression relationship using an angular bin method. The regression coefficients for each of the angular bin is developed as a Look-up Table (LUT) and the broadband albedo is estimated from Landsat observations using the coefficients according to the solar and viewing geometry [52]. Based on the simulation results by this direct-estimation algorithm, the total R2 is up to 0.9132 and RMSE is 0.0172 for comparison with ground observed albedo. The overall R2 and RMSE are about 0.96 and 0.013 respectively when examining the quantitative consistency of the estimation and GLASS albedo [54]. The good agreement indicates outstanding performance of the directestimation algorithm.
In general, the value of the GLASS white-sky albedo is higher than that of black-sky albedo, but the difference is very small. The blue-sky albedo (the actual bi-hemispherical reflectance) is the sum of both of them, including their weight.
Where α is the actual albedo, fdif is the proportion of diffuse irradiation, αdif and αdir are the white-sky albedo and black-sky albedo, respectively.
In clear-sky conditions, the diffuse ratio can be estimated by a simple practical equation of the form [56]:
Where θ is the solar zenith angle (SZA), a and b are coefficients.
2.3.2 The generation of high spatial and temporal albedo products
The annual high spatial-temporal resolution albedo data are produced by the retrieved Landsat albedo (or reference data) and the time series of the GLASS Albedo in the same year using the STARFM algorithm. STARFM was initially tested to predict the surface reflectance of the high spatial resolution by blending data of different spatial-temporal resolutions [42,44,45]. The Landsat surface albedo can be predicted by:
Where L represents the Landsat albedo imagery, M is the MODIS albedo image, (x, y) is the pixel location in both Landsat and MODIS images, and t is the acquisition date for the Landsat and MODIS data. Actually, compared to the Landsat image of the high spatial resolution, the pixels of the MODIS data are mixed pixels due to heterogeneity. If neighbouring pixels with similar spectral characteristics are introduced as additional information, the prediction accuracy will be greatly improved. A moving window technique is used, and the albedo value of the central pixel in is given by:
Where L(xw⁄2,yw⁄2,tn) is the value of a Landsat pixel, predicted for the time tn, w is the size of the searching window, and (xw⁄2,yw⁄2) is the central pixel within this moving window. The spatial weighting function Wijk determines how much each neighboring pixel contributes to the estimated value of the central pixel. M(xi,yj,tn) represents the MODIS albedo at the window location (xi,yj), while the L(xi,yj,tk)and M(xi,yj, tk) are the corresponding Landsat and MODIS data, observed at the base time tk, respectively [44].
Cloud in the Landsat and GLASS imagery is identified by corresponding pixel quality flags. The pixels with a low quality in both Landsat and MODIS data are predicted in the STARFM algorithm, but excluded from the analysis [56].
2.3.3 Calculation of the spatial and temporal change indicator of Albedo
We analyze the variation of surface albedo by average, standard deviation and coefficient of variation. The average value can represent the general level of the albedo. To explore the spatial distribution of the surface albedo in Hengshui during the past 15 years, we calculate the average albedo at a pixel scale as follows:
Where
The standard deviations of the albedo is used to reveal the temporal variation amplitude of the albedo at a pixel scale over 15 years. It can be described by formula (6).
In order to reflect the temporal change trend of the albedo, we first calculated the anomaly of the surface albedo. Anomaly is the difference between the albedo of one scene and the average image of the corresponding phase, which reveals the variation of the surface albedo in the study area, relative to the multi-year average, and eliminates the effects of seasonal changes [22]. It can be described by:
Δαt, αt represents the anomaly, surface albedo in phase i
(i=1,2,3,...,644) in the time series of all images from 2001 to 2015, and
For Δαi, anomalies of the time series, a linear function is fitted, and the slope v and intercept b are obtained by the least squares method. They are given by:
The fitting slope v is the coefficient of variation, with a positive value indicating an increasing trend and a negative value meaning a downtrend in the surface albedo, and the absolute value reveals the speed of change [57].
The regional average albedo of spring (March to May), summer (June to August), autumn (September to November) and winter (December to February) is calculated to reveal inter-annual variation of average albedo for different seasons from 2001 to 2015.
3. Results
3.1 Assessment of the prediction by STARFM
Two other Landsat images are used to assess the quality of the predictive results. The prediction accuracy is assessed by comparing the albedo directly retrieved from these Landsat images by formula (1) and the albedo products predicted by STARFM at the same period. The dates of the scenes for assessment are shown in Table 2.

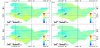
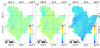
The synthetic land surface albedo is compared with the corresponding Landsat product over the study area during the growing season of 2007 and 2010, as shown in Figure 2. It can be seen that the albedo from the synthetic scenes and Landsat images have similar spatial patterns overall. Both the synthetic scene and Landsat albedo scene of 2007 reveal that the surface albedo in the southwest of Hengshui is higher than that in other regions, excepting Hengshui Lake, which presents a low value of surface albedo. The albedo for the assessment of 2010, shown in Figure 2b and Figure 2d, is higher in the south and north, and lower in the western part. Overall, the albedo in Figure 2b is overestimated compared to Figure 2d, especially in the middle part, while the western albedo is slightly underestimated.
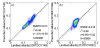
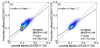
The spatial variation of the surface albedo due to the heterogeneity of the land surface can be captured effectively in the prediction by the STARFM algorithm. Thus, the synthetic imageries have the capability of detecting fine-scale natural changes and anthropogenic disturbances [58,59]. The slope between the retrieved and predicted albedo followed the 1:1 line very closely in the case of 2007, mainly because the land cover has not changed over a short time. Moreover, the value of RMSE is 0.012 (Figure 3a). Most of the points are located near the 1:1 line and the RMSE for the assessment of 2010 increases to 0.018 (Figure 3b). There is a slight overestimation of the predicted values (Figure 3b). Comparing the assessment data for 2007 and those for 2010, as the interval days between the input image and predicted image increase from 16 to 80, the accuracy of the prediction decreases. This might be caused by the change of land cover over a long period. Therefore, an appropriate time window should be taken into account, according to the actual demand, when the STARFM algorithm is used.
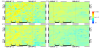
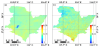
A visual investigation of the entire area reveals the albedo spatial pattern of the study area and the difference between the predictions and the Landsat albedo. To determine whether the details can reveal heterogeneity, subsets of the albedo image pairs are extracted from Figure 2, as shown in Figure 4. This shows clear details from the subsets of Figure 2. The albedo spatial pattern of the prediction and corresponding Landsat albedo generally agrees well, while the surface albedo is overestimated, compared with the Landsat retrieved albedo shown in Figure 4b and Figure 4d. The textures of the linear features and surface features in the synthetic scenes are distinguishable. The result demonstrates that the synthetic albedo scenes contain more spatial heterogeneity information than the GLASS albedo images.
3.2 The spatial-temporal variation of Albedo
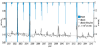
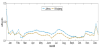
The temporal variation of average surface albedo, from 2001 to 2015 is shown in Figure 5. The standard deviation of the albedo change is 0.0435, and the variation amplitude is 0.399.Affected by the snowfall weather and leaf-off season, the average albedo shows a U-shape in a year, which is consistent with previous research [57]. Especially in early 2001, late 2002, late 2004, early 2005 and early 2013, the average surface albedo is greater than 0.4. We calculated the proportion of maximum snow extent (PMSE, i.e., the percentage of snow covered land to the total area of Hengshui) with MODIS Snow Cover Data, and found that PMSE in these years are greater than 0.8 because of the snow events (Figure 5). The albedo is highest in 2006, which might be partly due to low rainfall. The annual rainfall is 324.7 mm in 2006, which is the lowest in the study period of 2001-2015. The mean annual rainfall from 2001 to 2015 is 452.4 mm. Over the past 15 years, the albedo in Hengshui has been decreasing slowly, and the slope of the fitting straight line is -1×10⁻⁴. The variation ranges of the seasonal average albedo (Figure 6) inspring, summer, autumn and winter are 0.112-0.155, 0.106-0.149, 0.107-0.150, 0.128-0.238, respectively, and the average means in the different seasons are 0.136, 0.131, 0.129, 0.160, respectively. Affected by factors, such as vegetation coverage, the seasonal average albedo in winter is higher than in other seasons, while there is little difference in spring, summer and autumn. The fluctuations in the seasonal average albedo are greatest in winter because of the snow events. In the winter of 2002 and 2004, the average PMSE is greater than that of other years in 2001-2015 and the seasonal average albedo in winter of 2002 and 2004 is higher than that of other years correspondingly. It is relatively flat in spring, summer and autumn. The seasonal average albedo in autumn of 2015 is higher than that in other three seasons of 2015, which is attributed to the snow event in late November (Figure 5) with a PMSE of 0.82.
The average surface albedo, from 2001 to 2015 at pixel scale, is shown in Figure 7a. In most areas, the albedo is concentrated between 0.1-0.15. The surface albedo is lowest in Hengshui Lake and higher in the southern region of Hengshui (Jizhou, Zaoqiang, Gucheng), some areas of Raoyang. The area of plastic-mulched cultivated land accounts for more than 20% of the total area in these regions [61], and the use of plastic film and greenhouses during the period of cotton sowing and vegetable planting are the main causes of higher albedo in these regions. Similar results were also found in other studies. Hasituya et al. [61] compared the reflectance of different land cover classes based on Landsat-8 OLI image and Google Earth imagery of Jizhou on 29 April 2014, and found that the reflectance of the plasticmulched cultivated land is higher than that of other land cover classes on visible and near infrared bands. Lu et al. [62] and Zhao et al. [63] used similar spectral characteristics to monitor plastic-mulched farmland and greenhouses, and achieved good results.
The variation of the surface albedo in farmland and water is larger than that for other land use types, as shown in Figure 7b. The reason is that the surface albedo of farmland changes periodically, due to the influence of crop growth, and is lower in the crop growth season, while higher in the harvest season. The area of cotton is covered with a plastic film when cotton is sowed but is fallow in other periods. Thus, the surface albedo of the area growing cotton changes more significantly. The surface albedo of Hengshui Lake is low in spring, summer and autumn but increases in the winter because the water freezes in winter. The area with a high standard deviation (excluding Hengshui Lake) has a good consistency with that of the high average area. The fluctuation in the surface albedo in the cotton planting area and greenhouse area is higher than that in regions of winter wheat, which indicates that the use of plastic film and greenhouses affects the ability of the land surface to reflect solar radiation.
The variation coefficient v in the whole study area is negative, which indicates that the surface albedo has a decreasing trend from 2001 to 2015. Under the condition of the land surface, such as soil moisture, color, roughness, vegetation cover and other factors, the surface albedo at a pixel scale has no significant spatial regularity in the study period (Figure 7c).
3.3 Analysis of Albedo in late april
The growth of crops has a seasonal impact on the land cover and thus affects the albedo. In order to increase crop yields and protect from the loss of soil moisture, farmers usually use plastic film when planting cotton in April [61,62]. Recently, the cotton-growing area with plastic film accounts for more than 95% of the total cotton planting area in Hengshui [64]. In late April, the wheat entered a jointing-booting stage in the wheat-growing areas, where the vegetation coverage is high, while the surface albedo is low. In comparison, the surface albedo of the cotton-growing area, where the sowing has just finished, is high because of the influence of low vegetation coverage and plastic film. Therefore, we calculated the average and standard deviation of downscaled albedo at the end of April (DOY113) to analyse the changes of the surface albedo.
The spatial distribution of the average and standard deviation of albedo in late April of 2001-2015 is shown in Figure 8, where the average albedo is high in the cotton planting area and greenhouse area (Figure 8a). The average albedo of different land cover types was calculated based on the 30-meter Global Land Cover Dataset of 2010, and it is 0.142 and 0.138 for the cultivated land and artificial surfaces respectively for the whole region. The average albedo of cultivated land is higher in large area cotton planting counties, and it is 0.147, 0.149, 0.147 for Jizhou, Zaoqiang and Gucheng respectively. The proportion of plastic-mulched land to the total area of the corresponding county is 36.0%, 20.8% and 28.7% respectively. The average albedo is lower in small area cotton planting counties, and it is 0.133, 0.141, 0.135 for Anping, Wuqiang and Shenzhou respectively. The proportion of plastic-mulched land to the total area of the county is only 6.3%, 9.2% and 12.7% respectively [60]. Hengshui Lake presents a phenomenon with a low mean albedo of 0.06.
3.4 Analysis of the surface Albedo in Jizhou and Wuqiang
Jizhou is the area with the highest proportion of planting of Hengshui film cotton. In 2007, the planting area of cotton covered with plastic film in Hengshui is 1433 km2, while 23% of it is distributed in Jizhou, and that of Jizhou accounts for about 30% of its total area, while that of Wuqiang only accounts for 7% of its total area [64]. We analyzed the average value of the albedo in Jizhou and Wuqiang in 2007 to study the effect of different cropping patterns on the temporal variation of the surface albedo (Figure 9).
With the increase of film-covering and cotton sowing in spring, the surface albedo of Jizhou increases significantly, compared to that of Wuqiang. Owing to the harvesting of winter wheat, sowing of summer maize and irrigation, the surface albedo decreases and reaches the local minimum value at the end of June. With the growth of cotton and the sowing of summer maize, the surface albedo of Jizhou also reaches the local lowest value. With the development of boll, defoliation and harvest, the surface albedo average of Jizhou achieves the local highest level at the end of July. After September, the albedo of Jizhou is similar to that of Wuqiang, which is related to the ending of the growth period of cotton in this year.
4. Discussion
4.1 Comparison of the accuracy of Albedo Estimates from STARFM
This study evaluates the capability of STARFM to predict surface albedo data, with a high spatial resolution of 30m and high temporal resolution of 8 days, based on Landsat images and GLASS data from 2001 to 2015 over a study area of Hengshui, and analyzes the spatialtemporal variation in the period. It shows the capability of STARFM to estimate the surface albedo at a regional scale.
The STARFM algorithm accepts more than one image, with a high spatial resolution, in generating one synthetic scene to improve the predictive accuracy. However, the increasing in the number of input Landsat scenes does not necessarily contribute to the improvement of the accuracy, since the latter is affected by the time interval between the prediction and input, as mentioned previously. The assessment for the predictive albedo scenes with different numbers of Landsat albedo input images is shown in Figure 10. The prediction in Figure 10-a has only one Landsat albedo input image, retrieved on Apr. 16, 2015, while the prediction in Figure 10-b has two inputs, adding the image obtained on Sept. 7, 2015. The result demonstrates that the accuracy of the prediction with one Landsat albedo input scene is higher. The reason is that the time interval between the prediction and the second input image is long, the retrieved date of which is Sept. 7, 2015. Affected by the growth of crops and other factors, the condition of the land surface changed, and there is no improvement in the prediction for the date, 2015DOY138. Therefore, we select images with a fine spatial resolution during the growth period as much as possible.
4.2 Uncertainties analysis
To reduce the impact of cloud contamination and ensure the predictive accuracy for every year, one retrieved Landsat albedo image with a good quality and all GLASS data per year are used as input data to obtain the synthetic scenes for the year. The quality of the Landsat albedo input image has an impact on the predictive surface albedo. The use of GLASS composite data yields spatial-temporal continuous and cloud-free predictions throughout the 2001-2015 study period and therefore contributes to the prediction of changes in the surface albedo in more humid seasons, when cloud contamination prevents frequent cloud-free observation. However, as a synthetic albedo product, GLASS has a possible impact on the synthetic images. The maximum vegetation index value composite method of GLASS products for 8 days might partly filter out the effect of snow in winter. We found that, for some year, the predicted albedo in winter is lower than the actual albedo.
4.3 Future work
The inter-annual variation of albedo is related to changes in the crop planting structure, land use types (such as urbanization), and climatic conditions (such as precipitation). This paper only focuses on crop cultivation (such as cotton covered by plastic film). The impact of other factors is insufficient. In future research, we will analyze the impact of human activities and climate factors on the land surface albedo.
In order to obtain more accurate albedo data, it is necessary to improve the model or adopt an improved fusion model and use more high-resolution scenes.
5. Conclusions
Based on the Landsat reflectance images and GLASS surface albedo products, the STARFM algorithm is used to predict the surface albedo, which has the advantages of a high spatial resolution of Landsat images and a high temporal resolution of GLASS images. We assess the accuracy of the albedo data and analyze the spatialtemporal variation. Moreover, the following conclusions are obtained: (i) the STARFM algorithm enables synthetic imageries with a high spatial-temporal resolution, from 2001 to 2015 over the study area, to be obtained. When the time interval between the output image and input image is within an appropriate range, we can obtain synthetic data with a high accuracy. (ii) In the past 15 years, the surface albedo of Hengshui has been on a slow downward trend. Temporal variation of the albedo in Hengshui presents a “U-shape” in a year because the surface albedo rises rapidly, which is caused by the snowfall process in winter, while it is low in the other seasons. (iii) Surface albedo in the cotton planting area covered with plastic film and the greenhouse area is higher than that in other regions, and surface albedo in cotton planting area covered with plastic film increased during the time of film-covering and cotton sowing. Both of them indicate that the use of plastic film affects the spatial-temporal variation of the albedo. The albedo of Jizhou is higher from March to April than that in Wuqiang, which is due to the increase of film-covering and cotton planting.
Competing Interests
The authors declare that they have no competing interests.
Author Contributions
Qi Li, Rui Sun and Qiang Liu proposed the ideas; Qi Li, Tao Yu, Qinru Liu and Anran Zhu preprocessed and analyzed the data; Qi Li and Rui Sun prepared the paper.