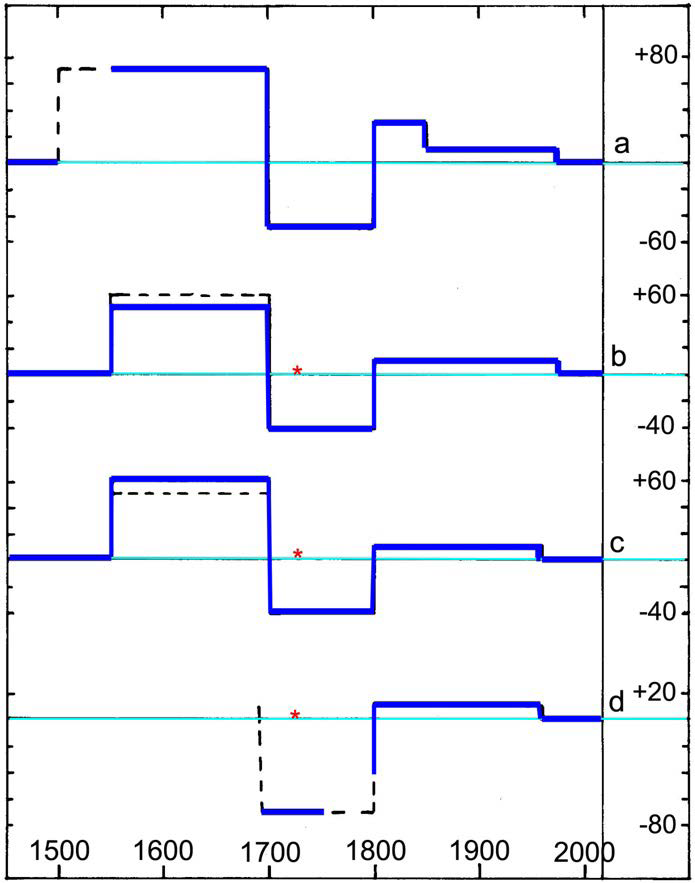
Figure 3: Observed sea level changes during the last 500 years in (a) the Fiji Islands [13], (b) the Maldives [16,18], (c) Goa [15,18], and (d) Bangladesh [17,18]. The sharp corners of the blue curves are a function of the identification of the high and low levels neglecting more real transitional curvatures. Red stars mark the 1733 tsunami event [15,18,27].