


1. Introduction
In both the United States and the developing world there is an increasing need for low-tech, low-cost solutions to our energy, resource, and waste management challenges. For example, the United States alone faces a $108.6 billion shortfall in water and wastewater treatment over the next five years and will require $390 billion in investments over the next two decades to update and replace the current systems [1]. Small rural municipalities in particular are at risk due to decreasing tax revenue and state and federal funding. In the United States are a total of 168,347 EPA registered waste water treatment plants (WWTP), of which 5,412 are in the State of New York. 14,440 of the registered plants are owned by municipalities, 573 of which are in New York [2]. The 2004 DEC data report [3] on wastewater treatment facilities shows that 370 WWTP have “small” capacities between 0.1 and 20.0 million gallons per day (MGD). 141 of these facilities send their sludge to landfills, 35 facilities carry out land spreading, and 35 other facilities use other sludge disposal means. Increasing environmental regulations call for new technologies that minimize sludge and increase the efficiency of existing WWTPs, without creating a financial burden on municipalities and other entities.
The increasing needs for water resources for residential, commercial and industrial use accelerate the depletion of the water resources. Reuse of the effluent water after treatment becomes an effective solution to the shortage of the water resources. But limitations of the treatment technologies may leave some chemicals like Pharmaceuticals and personal care products (PPCPs), in the treated water and the treated water discharge to the surface.
PPCP’s is one group of “Emerging Contaminants,” a name that has been used by the EPA since the 1990s [4].
PPCPs have many possible inlets into the water supply [5]. Rising levels of pharmaceutical compounds in wastewater can have a dramatic and disconcerting effect on local wildlife and toxic effects on marine organisms [6].
PPCPs include a diverse collection of thousands of chemical substances, including prescription and over-the counter therapeutic drugs, veterinary drugs, fragrances, cosmetics, sun-screen products, diagnostic agents, and nutraceuticals [7].
PPCPs have been present in ecosystems for decades at a trace level concentration (i.e., at μg/L or even ng/L) [8]. Studies were not put on them at first because of the technology limit. Now with advances in technology that provide the ability to detect and quantify these “undetectable” chemicals, they can be identified what effects they could have on humans and the environment.
PPCPs have been a serious problem as they are widely used and some of them are harmful to the environment and humans. From 1999 to 2000, Barnes et al [9]. conducted a nationwide survey in the US, and identified the occurrence 95 different pharmaceuticals, hormones, and other organic wastewater contaminants (OWCs) in 139 streams in 30 states. The survey showed that at least one OWC was detected in 80% of the streams sampled, with 82 of the 95 analyzed OWCs determined in this study detected in at least one sample. Also, PPCPs can easily enter the environment, for instance through manufacturing plants, effluents of sewage treatment plants, household waste, and landfill effluent [10]. In 2009, Cheri Garvin, CEO of the Leesburg Pharmacy, made a statement about secure and responsible drug disposal that U.S. manufacturers had legally released 271 million pounds of drugs into the environment, and an estimated 250 million pounds of pharmaceuticals and contaminated packaging were discarded by hospitals and long-term care facilities [11].
PPCPs are potential pollutants because they often have similar physic-chemical behavior as other harmful xenobiotics which are persistent or produce adverse effects. Low concentration levels (ng/L or μg/L) of pharmaceuticals can induce toxic effects [12]. Studies (Hannah et al. 2009, Lange et al. 2001, Kidd et al. 2007, and Caldwell et al. 2008) on fish showed that after long-term exposure to some of the PPCPs, PPCPs could interfere with the endocrine system [13-16]. But risks to humans in both short-term and long-term exposure at low concentration remain poorly understood [17]. More research is needed in the future.
Currently, there is no economical technology available to remediate PPCP compounds in existing large and small scale municipal waste water treatment facilities (WWTF) in a sustainable manner, which can be tailored to the individual needs of the WWTP in regards to treatment volume and contaminations contained in the waste water.
One emerging technology that has the potential to a substantial degradation PCCP’s is a constructed wetland (CW). CW isa manmade systemsthat mimics natural wetland and representa low-energy solution to deal with most wastewater treatment needs, and is capable removing metals, biological oxygen demand (BOD), ammonia, and phosphate [18,19]. CW are able to remove PCCP’s by sorption [20] and biological degradation in horizontal flow CW. The removal process of PCCP’s is very dependent of design, flow and presence and presence of plant and gravel media [21]. CW can represent an alternative natural treatment option using microbiological processes for the remediation of PCCP’s instead of conventional treatment systems installed at WWTP[20,22,23,24], but need to be adjusted to the individual operational parameters needed at municipal WWTP’s.
The presented study used a controlled operated CW operated as a subsurface bioreactor (S2BR)located at the Village of Minoa’s Cleanwater Educational Research Facility (CERF) which can treat up to120,000 gal of waste water per day.
2. Material, Methods And Experimental
The methodology section describes the different materials, methods and processes used for this Project executed at the Village of Minoa’s Cleanwater Educational Research Facility (CERF) which can treat up to 900,000 gal. (3,400,000 l) of waste water per day.
2.1 Materials
The study focused on two non-steroidal anti-inflammatory (NSAID) drugs used to relive pain and inflammatory disorder. The NSAID drugs Ibuprofen (active ingredient in Advil) Figure 1 and naproxen (active ingredient in Aleve) Figure 2. belong to the most commonly used pharmaceuticals worldwide.
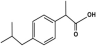
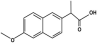
Ibuprofen and naproxen represents an aromatic compound containing benzene and benzene- based molecules with increasing structure and stability, which may determine its elimination or excretion in organisms and interactions in the environment. Ibuprofen and naproxen are acidic, polar compounds with high water solubility and low volatilization potential.
2.2 Sample analyses
The municipal waste water (WW) samples were collected in 1l nalgene bottles and frozen before analyzing. The first data set was analyzed using EPA Method 1694 for pharmaceuticals and personal care products in water, soil and sediment and biosolids by HPLC/MS/ MS [26].
The second data set was analyses with HPLC at a certified testing laboratory by adding an isotope-labled substance to a determined ample volume. The samples were transferred to an solid phase extraction (SEP) cartridge (Oasis HLB, 6ml, 150mg), dried and eluted with 12.5 ml of acetonitrile. After that the eluate was evaporated under N2 and dissolved in 1 ml of ACN / water (40/60 v / v) + 0.1% formic acid. A 0.45 μm cellulose / glass fiber filter from Wicom was used to remove suspended particles from the prepared sample. HPLC analyzes was carried out using test was perfomed with Ibuprofen-d3 and Naproxen-(methoxy-d3) standards from Sigma-Aldrich.
2.3 Experimental
2.3.1 Subsurface bioreactor (S2BR)
The systems investigated in this study for PPCP removal of Ibuprofen and Naproxen are a S2BR system and a Sequencing Biological Reactors (SBR).
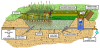
The basic layout of a S2BR cells used in this study is shown in Figure 3. Half of the S2BR is planted half with grass and the other half with Phragmites. The complex root system of Phragmites and grass in the cells as well as bacteria cultures present help take up nutrients and filter the water. The S2BR is filled with clarified WW from the bottom until the cell is filled completely for the planted and unplanted part of the S2BR. The influent wastewater is then stopped and the cell is drained by opening a valve at the bottom of the cell at the opposite end of the S2BR. The hydraulic fluctuation from a empty cell to a filled cell is called tidal flow system (TFS) and creates aerobic and anaerobic interfaces, or redox gradients, due to the frequent change in dissolved oxygen concentrations [27,28]. Stagnant zones are not present due to the constant movement and flow of water.The wastewater is continuously making contact with the different bacteria growing on the media layers, which increases biological breakdown of contaminants [29].Cells 1 and 2 of the S2BR are operated as a TFS and have a size of 30.50m x 61.00m with an average depth of 0.30m.
S2BR Cell 3 is slightly smaller than cell 1 and 2 with a size of 24 m x 55 m and has an average depth of 0.3 m. the cell is operated as a horizontal flow system (HFS). The effluent from the preceding S2BR cell enters the cell and moves verticallythrough the subsurface media, then exits the S2BR cell through overflow weir and drainpipe. Horizontal flow systems (HFS) have a high nitrificationdue to their low oxygen levels compared to a TFS whereas bacteria can excel due to the high amounts of oxygen in the system. The use of TFS and HFS S2BR can be used in combination to increase contaminant removal [30].
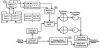
At the Minoa WWTF, municipal sewage is treated in the S2BR according to the schematic flow chart in Figure 4. Approximately 1.8 million l/d of municipal waste water (WW) enter the WWTF through an influent structure where a prescreening process removes large impurities. From the influent structure half of the waste water is pumped to a primary clarifier, the other half is pumped into a sequential batchreactor (SBR) where it is treated and discharged after chlorination.
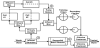
Half of the clarified water from the primary clarifier, approximate 450,000 l/d is directed into an influent box 1 that feeds the S2BR cell 1 and 2 operated on a tidal fill drain cycle whereas cell 3 operates as a through flow cell. The other half of the clarified WW is transferred to influent box 2. Influent box 2 also received the effluent water from the S2BR. The effluent from influent box 2 is transferred to the trickling filters followed by secondary clarifier treatment and chlorination.
In Cell 1 and 2 of the S2BRare operated as an TFS at an 24 h fill and drain cycle. The clarified WW is fed in the S2BR cell from the bottom until the cellis filled completely forthe planted and unplanted part. The influent wastewater is then stopped and the cell is drained by opening a valve at the bottom of the cell. While one cell drains the other cell is filled.The effluent from Cell 1 and 2 of the S2BR becomes thenthe influent of cell 3 of the S2BR operated as an HFS.
For data set 1 samples were taken from the WW influent (1), S2BR effluent (3), and SBR (2).
After an rebuild of the S2BR system, SB2R cell 2 is now dormant. Cell 1 and cell 3 have recirculation added to the planted and unplanted part of the S2BR. In addition both cells are operated as a HFS with additional aeration supplied by the recirculation (Figure 5). data set 2 samples were taken from the WW influent (1), SBR effluent (2), S2BR effluent planted and unplanted (3), and S2BR cell 3 planted and unplanted (4).
The effluent from the S2BR system is redirected into the influent box where it mixes with the primary clarified water. The WW from the influent box is then forwarded for final treatment into the trickling filters followed by secondary clarifiers and chlorination before the cleaned WW is discharged into a stream.
2.3.2 Sequential Batch Reactor (SBR)
The SBR at the WWTP consists of two parallel tanks operating at alternating 4 hour aeration and settling cycle. Each of the SBR tanks is about 12ft. (3.7 m)deep, 25ft.(7.6 m) wide and 50 ft. (15.2 m) long. The raw sewage passes through a prescreening process and then enters one of the two tanks where it is aerated and mixed for approximately two hours per cycle. The biological colony in this tank consumes the organic fraction of the wastewater, reducing the Biochemical Oxygen Demand (BOD) and the ammonia. After aeration, the air is shut off, the incoming sewage is diverted to the adjacent tank and the mixed liquor is allowed to settle. After a period of settling, the treated supernatant is removed with a mechanical decanter and passes a chlorination treatment before the cleaned WW is discharged into a stream. The biosolids from the SBR are collected and dewatered and moved to a landfill.
3. Results and Discussion
At CERF typical influent waste water quality parameters are dependent on seasonal factors such as rain fall, temperature, day of the week, etc. and therefore have a certain variance on a daily bases. The effluent levels of the waste water treatment plant are set by the authorities and need to be maintained, regardless of the influent levels. Influent and effluent data are measured at a certified laboratory on a by-weekly schedule. The waste water treatment plants influent WW rages for total phosphorous (TP) between 1.0 to 12.0 mg/l, ammonium (NH3) from 10 to 30 mg/l, total Kjeldal nitrogen (TKN) from 15 to 45 mg/l, chemical oxygen demand (CBOD) from 50 to 200 mg/l, total suspended solids (TSS) from 150 mg/l, and biological oxygen demand (BOD5) from 50 to 350 mg/l at an average temperature of 15°C.
Effluent parameters permitted to reach a maximum for TP of 0.8 mg/l, NH3 of 0.5 mg/l, TKN of 1.3 mg/l, CBOD <4 mg/l, TSS of <4 mg/l and BOD5 of <4 mg/l.
Based on testing PPCP’s at CERF, in specific Ibuprofen and Naproxen the influent level of thesepharmaceuticals can range between0.40 μg/l to 45.00 μg/l and is very dependent on seasonal factors including weather conditions and day of the week, even presence of residents during the day. Based on this, influence level of PCCP’s vary day by day even hourly and therefore, the remediation of PCCP’s compounds is greatly influenced by the specific influent levels at the time of testing.
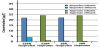
The pharmaceutical removal rate of the S2BR and SBR prior to rebuild is shown in Fig. 6.At an influent level of 22.7 μg/l for ibuprofen and 24.20 μg/l for naproxen the S2BR cell 3 effluent level ibuprofen was 3.76 μg/l and 1.21 μg/l for naproxen at a removal rate 83.12% and 95.00%.
The SBR effluent level of ibuprofen was 0.34 μg/l and 0.12 μg/l for naproxen at a removal rate of 98.47% and 99.50% at the same influent concentration as for the S2BR.
The pharmaceutical removal rate of the S2BR and SBR after the rebuild is shown in Figure 7. At time of testing PCCP influent levels were significant lower as during the first testing. In addition, longer rain period prior to testing resulted in a higher influent stream to the WWTP prior to testing and might have influenced the testing results. At an measured influent level of 0.4 μg/l for ibuprofen and 1.05 μg/l for naproxen the S2BR effluent level of cell 1 plantedwith phragmites showed an effluent level of 1.64 μg/l for ibuprofen and 1.11 μg/l. The grass planted part of cell 1 had an effluent level of ibuprofen of 1.59 μg/l and 1.15 for Naproxen. Both parts of the cell 1 showed an increase of concentration of 3.10 times for ibuprofen and 5.71% for naproxen.
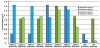
This result could be explained that PCCP’s adsorb onto the media at higher concentrations and is released at lower WW influent levels of PCCP’s. However, further investigations are needed.
Cell 3 planted with phragmites showed an effluent level of `1.00 μg/l for ibuprofen and 0.37 μg/l for naproxen at a removal rate of 39.02% and 66.67%. The grass planted part of cell 3 had an effluent level of ibuprofen of 1.44 μg/l and 0.69 for Naproxen at a removal rate of 9.43% and 40%.
The SBR effluent level of ibuprofen was 0.13 μg/l and 0.10 μg/l for naproxen at a removal rate of 67.50% and 90.48% at the same influent concentration as for the S2BR.
4. Conclusions
These results of this study indicate that both the S2BR and SBR system are effectivein removing ibuprofen and naproxen pharmaceutical compounds from municipal WW.However, the removal rate of PCCP compounds is greatly influenced by the mode of operation anddaily operational factors and variations that cannot be know in advance.
The SBR system shows an overall greater removal rate between 67.5 % for low influent levels of 0.40 μg/l to 1.05 μg/l and up to 99.5% for influent levels of up to 24.20 μg/l. However, it is unknown how many pharmaceutical compounds are removed with the sludge of the SBR that is sent to a landfill. This amount might lower the removal rate of the SBR and will need further investigation.
The S2BR technology can remove pharmaceutical compounds in the range of 40% to 95% depending on the pharmaceutical compound, the operation procedure and the influent level. The S2BR showed after the rebuild an overall lower rate of removal between 9.43% of up to 66.67% at influent levelsabove0.40 μg/l to 1.05 μg/l. whereas the removal rate of pharmaceuticals increases to 95% for influent levels over 22.00 0.40 μg/l. For influent levels below 0.40 μg/l the S2BR showed a negative removal rate.
The data indicates that both systems remove ibuprofen and naproxen from WW better at higher influent levels. However, the operation cost of a S2BR are significant lower compared to a SBR system which requires a significant higher investment cost, electricity and compressed air for aeration during operation as well as additional daily maintenance. Further studies are needed to analyze the PCCP removal rate of the SBR including PCCP that might be adsorbed on the sludge that is sent to a landfill. At present time the PCCP content of the sludge is not known. The operation of the S2BR needs to be investigated regarding operational procedures, removal rate at higher influent levels and hydraulic retention time of the WW in the S2BR cells including sorption on S2BR media and plant roots in more detail.
Competing Interests
The authors declare that they have no competing interests.
Acknowledgments
The authors are grateful for the support provided TRINITY Institute at SUNY-ESF, The Village of Minoa and the US Golf Association for providing part of the funding for the project.