


1. Introduction
Plant photosynthesis is an important process in terrestrial ecosystem which mediates gas and energy exchanges in the atmosphere-biosphere system [1,2].As the underlying process for plant growth, photosynthesis serves as an essential indicator of plant efficiency and agricultural management practices [3,4]. Additionally, spatially and temporally explicit estimation of photosynthesis on the ecosystem scale (Gross Primary Production, GPP) can provide significant information in studying terrestrial carbon budget.
Net photosynthesis can be quantified at leaf scale by monitoring CO2 exchange using chamber enclosure systems combined with infrared gas analyzers [5], and at ecosystem scale using flux towers and eddy covariance techniques [6,7]. However, these measurements are difficult to extend to large scales due to the relatively sparse observations and the spatial heterogeneous. Therefore, at landscape or regional scale, gross photosynthetic CO2 assimilation, also termed as gross primary productivity (GPP), is usually obtained using models and algorithms that integrating ground observations with remotely sensed data [8,9].
Satellite remote sensing has provided various fundamental data to support studying and monitoring GPP in recent years [10-15]. Among which, the MODIS product for GPP is one of the mostly used dataset designed to contributing to carbon cycle research [16]. Reliably estimation of GPP is often linked with the accuracy of several physiologic and biochemical parameters, such as Leaf Area Index (LAI) and Fraction of Photosynthetically Active Radiation (FPAR), which are generally derived using reflectance-based indices [17]. However, these “greenness” indices can only be used to determine photosynthetic capacity as they represent a mixed signal from leaf chlorophyll content and canopy green biomass and structure. It also should be noted that “greenness” indices often have a relatively low sensitivity to short-term variation in vegetation situations and cannot be used to reflect actual plant photosynthetic functioning [18]. To our knowledge, only the Photochemical Reflectance Index (PRI), which is based on the sensitivity of reflectance at 531 nm to xanthophyll pigments, has been shown to be sensitive in tracking actual photosynthesis [19]. However, PRI has also been proved to be sensitive to soil background and canopy structure, which limits its application over global scale [20,21]. Recently, remote measurement of Solar-Induced Chlorophyll Fluorescence (SIF) has opened a new perspective to assess plant actual photosynthesis [22-24]. Chlorophyll fluorescence is the re-emission of solar radiation absorbed by leaf chlorophyll at longer wavelengths. It has a distinct spectral shape with one peak at 730-740 nm (far-red fluorescence) and another at 685-690 nm (red fluorescence). Pervious researches proved that about 80% of the absorbed solar energy by vegetation is used for photosynthesis, and approximately 1%-2% released as fluorescence and 19% released as heat [25]. Since chlorophyll fluorescence is directly related to the internal photosynthesis mechanisms of plants, fluorescence signal can be considered as an indicator for the functional status of actual plant photosynthesis. Chlorophyll fluorescence has been used in leaflevel studies of photosynthesis under laboratory conditions for several decades [26,27]. As SIF successfully derived at canopy scales, some research demonstrated SIF showing strong links to GPP at the level of canopy[20,28,29]. Liu et al. demonstrated that the SIF is linearly related to GPP over canopy scale [30,31]. Recently, global SIF have been obtained using orbiting platforms with high spectral resolution, such as the Japanese Greenhouse gases Observing SATellite (GOSAT) [32], the Scanning Imaging Absorption spectroMeter for Atmospheric CHartographY (SCIAMACHY) [34], the Global Ozone Monitoring Experiment-2 (GOME-2) [35], and the Orbiting Carbon Observatory-2 (OCO-2). Among which, the GOME-2 platform can provide long-term SIF data from 2007 with relatively high spatial resolution. The availability of chlorophyll fluorescence data at continental and global scale enables the establishment of a direct link between SIF and actual plant photosynthetic activity at ecosystem, landscape and regional scales. A simply positive linear relationship between SIF and GPP was also generated over regional scale by Frankenberg et al. [33], Guanter et al. [22], Zhang et al. [36], they also demonstrated that SIF was more sensitive in tracking GPP than traditionally used Normalized Difference Vegetation Index (NDVI) and Enhanced Vegetation Index (EVI). This linear SIF-GPP model was also considered a reasonably GPP estimation approach without dependency on climate inputs and satellite-based vegetation indices [37].
Although previous studies have indicated that SIF is an excellent proxy for GPP, it also should be noted that the SIF-GPP relationship would be affected by various factors, i.e., environmental factors [33], vegetation types [30,38], temporal scale [24,39], structural and physiological interferences [40]. In a recently model analysis, Verrelst et al. [41] found that the traditionally used SIF signal at 760 nm cannot reflect GPP properly, which suggested that some uncertainties were still existed in determining the SIF-GPP relationship. Therefore, this study aims to assess the factors that determining the relationship between SIF and GPP. We use the remotely sensed SIF, GPP, land cover type together with land surface temperature to determine the impact of ecosystem and land surface temperature on the SIF-GPP relationship.We also utilize an integrated photosynthesis-fluorescence model, the Soil-Canopy Observation of Photochemistry and Energy fluxes (SCOPE) model [42], to investigate the impacts of shortwave irradiance, chlorophyll content and LAI. Our findings serve to a better understanding of the information inherent in SIF and its functional relationship to GPP.
2. Materials
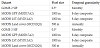
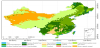
A combination of GOME-2 SIF, MODIS GPP (MOD17A2), Land cover type (MCD12Q1) and Land Surface Temperature (LST) (MOD11C3) of China were used to investigate the impact of ecosystem and LST on the SIF-GPP relationship in this study. The characteristics of data used were listed in table 1. As China's landscape is vast and diverse, it ranges from forest steppes and the Gobi and Taklamakan Deserts in the arid north to subtropical forests in the wetter south (Figure 1), which is suitable to do our research.
2.1 SIF retrieved from GOME-2
SIF data used in this study were derived from GOME-2 onboard the EUropean METeorological SATellite (EUMETSAT)’s polar orbiting Meteorological Operational Satellite (MetOp-A) platform launched in October 2006. GOME-2 measures the 240-790 nm wavelength region with spectral resolution between 0.2-0.4 nm and a footprint size of 100 × 80 km2. SIF retrieval algorithm is based on the inversion of top-of-atmosphere measurements in the 715-758 nm windows that overlap SIF emission, which disentangles the contribution of atmospheric absorption and scattering, surface reflectance, and fluorescence to the measured top-of-atmospheric radiance spectra. The retrievals are quality-filtered (e.g., heavily cloud contaminated data removed) and aggregated to monthly means at 0.5°×0.5° spatial resolution [35]. Compared with the traditionally used GOSAT and SCIAMACHY, GOME-2 can provide continuous observations and higher spatial resolution data, respectively. Additionally,the GOME- 2 platform can provide long-term SIF data when compared with the OCO-2 which is launched in 2014.By considering data availability, monthly GOME-2 SIF data of China in 2013 were used (http://avdc.gsfc.nasa.gov/index.php?site=296832442&id=66&go=list&path=/GOME_F).
2.2 MODIS products
In our study, the MODIS GPP product (MOD17A2) is used to investigate the SIF-GPP relationship. MOD17A2 is provided as an 8-day composite product at 1 km spatial resolution. MODIS GPP is generated using a light use efficiency (LUE) approach. Although pervious researches suggested that MOD17A2 might underestimated GPP at high productivity and overestimated GPP at low productivity [43]. We consider it can provide reliable GPP estimations in most cases this time.
The MODIS products for land cover type (MCD12Q1) with spatial resolution of 500 m is used to analyze the impact of ecosystem on the SIF-GPP relationship. We use the MODIS-derived Net Primary Production (NPP) classification scheme to match with the MOD17A2 product.
The MODIS land surface temperature (LST) product (MYD11A2) is also used to assess the impact of LST on the SIF-GPP relationship. MYD11A2 is configured on a 1 km spatial resolution as the average values of clear-sky LST during an 8-day period. The MYD11A2 dataset is chosen because it provides observations at 1:30 am and 1:30 pm, which is close to the daily minimum and maximum temperature, respectively. We used their averaged values to represent daily mean LST.
To match with the GOME-2 SIF dataset, all MODIS data in 2013 are spatial aggregated to a 0.5°spatial resolution and temporal averaged to monthly scale. It should be pointed out that different aggregating strategies were preformed to these three types of data: For MCD12Q1 and MYD11A2, the averaged value in each 0.5°×0.5° area is used, and for MOD17A2, we assign the land cover type in a 0.5°×0.5° area using the dominant land cover type.
3. Methods
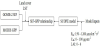
In this study, we used GOME-2 SIF, MODIS GPP, Land cover type and LST of China to investigate the impact of ecosystem and LST on the SIF-GPP relationship. We also adopted the SCOPE model to investigate the impacts of shortwave irradiance (Rin), chlorophyll content (Cab) and LAI.The overall workflow is shown in Figure 2.
3.1 Statistical analysis of SIF-GPP relationship
Photosynthesis (carbon assimilation or GPP)can be represented by a light-use efficiency theory [44]:
Where PAR is the photosynthetically active radiation, FPAR is the fractional of absorbed photosynthetically active radiation, εP is the light use efficiency at which absorbed radiation is used by photosynthesis.
The flux of emitted fluorescence, SIF, can be expressed by an equation analogous to the equation for photosynthesis [22]:
Where εP is defined as the quantum yield for fluorescence, which represents the fractional APAR photons that are re-emitted from the canopy as SIF photons, fesc accounts for the fraction of SIF photons escaping the canopy.
As GPP and SIF are both directly linked with the absorbed photosynthetically active radiation, equation (1) and (2) can be rearranged to obtain the following equation:
where fesc can be assumed as 1 for simple plant structure and high LAI situations in the near-infrared wavelengths [22].
Previous studies demonstrated that εP and εF tended to covary in most cases [25], which suggested that SIF would provide effectively information for estimating plant photosynthesis. However, εP, εF, and fesc are known to vary across ecosystems and environmental conditions [22]. In order to evaluate their impacts on the SIF-GPP relationships, we carried out statistical analysis between GOME-2 SIF and MODIS GPP under different ecosystems and different LST conditions. The coefficient of determination R2 was used to quantitatively describe the goodness of fit.
In this study, we conduct the statistical analysis of SIF-GPP relationship to evaluate whether SIF can be used to ascertain GPP, and to what extent the SIF-GPP relationship is affected by vegetation types and LST.
3.2 SCOPE model simulation
SCOPE is a vertical (1-D) radiative transfer for optical and thermal radiation in which a Soil-Vegetation-Atmosphere-Transfer (SVAT) scheme is added for calculating canopy photosynthesis and energy balance fluxes [42]. It treats radiation transfer in the multilayer canopy as a function of solar zenith angle and leaf orientation to generate reflectance and fluorescence in the observation direction. The radiative transfers at leaf level are calculated with the Fluspect model, which is an extension of the leaf optical model of PROSPECT [45] and includes the calculation of scattering of chlorophyll fluorescence within leaf. The optical radiative transfer within the canopy is calculated based on the (Scattering of Arbitrarily Inclined Leaves) SAIL theory, the thermal infrared radiative transfer is modelled following Verhoef et al. [46], and the canopy fluorescence radiative transfer schema is calculated based on FluorSAIL. As C3 and C4 pathways of photosynthesis demonstrate different biochemical and physiological properties, photosynthesisis calculated following the theories of Collatz et al. [47] and Collatz et al. [48] for C3 and C4 plants, respectively in the SCOPE model. SCOPE simulates GPP and spectrally distributed SIF with a spectral resolution and a spectral sampling interval of 1nm. It also calculates the spectra of reflected and emitted radiation above the canopy under certain observation geometry with spectral resolution of 1, 1, 100 and 1000 nm in visible, near and shortwave infrared and thermal domain, respectively.
Due to the fact that SIF and GPP are influenced by a combination of environmental, biochemical and physiological characteristics, we chose three types of factors including shortwave irradiance, chlorophyll content and LAI to reflect the influence of environmental, biochemical and physiological characteristics, respectively. In this study, we carried out three types of simulation using SCOPE v1.53. In the first simulation, we calculated εP and εF as function of varying short wave irradiance. For the second simulation, we generated εP and εF for different chlorophyll content, and for the third simulation, we considered the influence of LAI.
The purpose of these simulations are to assess the impacts of short wave irradiance, chlorophyll content, and LAI, and determining how and in which way these factors influencing the SIF-GPP relationship.
4. Results and Discussion
4.1 Spatially distributions of GOME-2 SIF and MODIS GPP
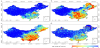
The monthly SIF maps (March, June, September, and December) referenced to 737 nm derived from GOME-2 for the years 2013 are displayed in Figure 3. A significant seasonal progression is visualized across the four maps, which corresponds well with the characteristic of vegetation phenology in seasonality. The values of SIF signal increase over time since spring and achieve the highest at summer, then decline and meet the minimum at winter. Spatially, high fluorescence values are found in the southern part of China covered mainly by forest. The Changbai Mountain located in the northeast part of China also displays high fluorescence values, which can be attributed to the biodiversity and highly vegetation coverage over this region as it is well-protected. Nearly zero values are detected over the northwest part covered mainly by barren or sparsely land (Figure 1).
The spatially and temporally distributions of MODIS GPP show high agreements with the GOME-2 SIF (Figure 4). High values are presented both at the Southern and Northeast part of China, and low values are distributed over the Northwest side. Besides, both GPP and SIF show similar seasonal dynamic patterns corresponding with the vegetation growth.
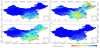
The coherent spatial and temporal patterns between SIF and GPP indicated the potential of SIF signal in determining GPP.
4.2 Relationship between GOME-2 SIF and MODIS GPP
To quantitatively analyze the patterns of GPP and SIF, we conducted statistical analysis between SIF and GPP. The coefficients of determination were calculated between the gridded SIF and GPP datasets. The statistical analysis shows that a linear regression model could represent well the relationship between GOME-2 SIF and MODIS GPP, especially during the growing season (April to October) in 2013 (Table 2). However, the SIF-GPP relationship does not perform well in January, February, and December, which may be attributed to both the environmental factors and the data qualities.
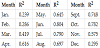
We noticed that the SIF-GPP relationship tended to vary across time. This kind of seasonal dynamic characteristic of the SIF-GPP relationship also indicates a potential limitation in exploiting SIF as robust constraint for estimating GPP.
4.3 Assessment of factors determining the SIF-GPP relationship
To minimize the uncertainties introduced by the different spatial scales of the GOME-2 SIF and MODIS GPP data, and to decrease the noises caused in SIF retrieval approach, both SIF and GPP were averaged to derive seasonal SIF and GPP.
In this study, the MODIS land cover type product (MCD12Q1) was used to investigate the SIF-GPP relationship across different ecosystems, which can demonstrate the effects of some structural and physiological interference. We deployed the MODIS-derived Net Primary Production (NPP) land cover classification scheme of MCD12Q1 to analyze the system-specific SIF-GPP relationship (Figure 5).
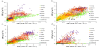
As Figure 5 illustrates, the SIF-GPP relationship does not remain constant under different ecosystems, their relationship also demonstrated a significant seasonal dynamic characteristic. Croplands present lower GPP values while forests (including mixed forest, evergreen broadleaf forest, deciduous needle leaf forest and deciduous broadleaf forest) demonstrate higher GPP values when SIF values remain constant. Additionally, both SIF and GPP for open shrublands were generally lower than other land cover types. Statistical analysis showed that a linear model could describe the SIF-GPP relationship for croplands and mixed forest. The coefficient of determination R2 could reach 0.66 and 0.78 for croplands and mixed forest, respectively. However, the goodness of model fit for other land cover types were generally lower.
The impact of ecosystem on the SIF-GPP relationship can be attributed to the diversity of canopy structural and leaf physiological characteristics within each ecosystem. Additionally, the different environmental situations corresponded to each kind of ecosystem can also affect the SIF-GPP relationship.
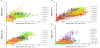
In order to assess the impact of surface situations, we utilized MYD11A2 to derive seasonal SIF-GPP relationship under different LST conditions (Figure 6). We noticed the SIF-GPP relationship was affected by LST as well. Linear models could well represent their relationship when LST ranging between 15°C and 30°C, the coefficient of determination R2 could reach 0.72, 0.81 and 0.61 for 15-20°C, 20- 25°C and 25-30°C, respectively. The statistical relationships get worse when LST is higher than 30°C or lower than 15°C. Temperature conditions would affect both the light reaction and the CO2 assimilation processes in photosynthesis. SIF, however, is produced in the light reaction process. This kind of mismatch would result in significant uncertainties in determining the SIF-GPP relationship.
In this study, we deployed both the GOME-2 SIF and the MODIS GPP products to analyze the relationship between SIF and GPP. We assumed these two datasets could provide reliable estimated values. However, MODIS GPP product is generated based on a simple LUE theory which assumes GPP is directly related to the absorbed photosynthetically active radiation (APAR) [16]. It has been proved to be underestimated at high productivity and overestimated GPP at low productivity [38], which may introduce some uncertainties in our study. Moreover, GOME-2 SIF product has a relatively large footprint and clouds are present in almost every pixel. Although the retrieval approach can tolerate a small amount of cloud contamination, clouds will obscure the surface signal from the satellite view as well. Due to the fact that our research relies heavily on the quality of the datasets used, further studies are still needed to obtain a more reliable relationship between SIF and GPP. The planned Fluorescence Explorer (FLEX) mission is explicitly optimized for detecting SIF signal at a spatial resolution of 300 m, which will provide high quality SIF datasets. Together with the FLUXNET datasets, which can be used to derive GPP at site level [49], more reliable SIF-GPP relationship can be obtained over regional and global scale in the future.
4.4 SCOPE simulations
The SCOPE model was used to simulate εP and εF under differentshortwave irradiance, chlorophyll content, and LAI situations. It should be noted that these two parameters were all obtained over canopy scale, thus the influence of fesc in equation 3 is included in the obtained canopy εP and εF.
We utilized the standard values of meteorological, canopy structural and leaf physiological parameters, and several biochemical parameters in our research. Short wave irradiance, chlorophyll content, and LAI were set to ranging from 150- 1200 μmol•m-2•s-1, 0 to 100μg•cm-2, and 0 to 6, respectively.
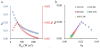
Figure 7 illustrates the SCOPE simulated εP , εF together with the εP- εF relationship under different short wave irradiance (Rin) conditions. As Rin increases, εF increases firstly and then decreases, and εP decreases with Rin, which is consist with the research of Lee et al. [50] The relationship between εP and εF is negative linear correlated when Rin is lower than 150 W•m-2 because these two parameters competed with each other when irradiance is low. However, their relationship tend to be positive when Rin is higher than 150 μmol•m-2•s-1, which may be attributed to the increment of non-photochemical quenching (NPQ). It should be noted that the εP-εF relationship is not linear over the whole Rin extent.
As for chlorophyll content, εP decreases as chlorophyll content (Cab) increases, and εF increases firstly and decreases slightly after reaching its maximum (Figure 8). The increment of chlorophyll content will definitely lead to higher photosynthesis and higher fluorescence. However, the increasing rate of photosynthesis may be lower than then the increasing rate of APAR, which will lead to the decrement of εP. The relationship between εP and εF is proved to be nonlinear as well.
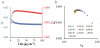
The SCOPE simulations also indicates that a higher LAI value would lead to a higher εP. However, εF shows a decreasing trend as LAI increases. The decrement of εF may be attributed to the increasing of canopy re-absorption (Figure 9). When LAI is above 1.0, the relationship between εP and εF tend to be linear (R2 = 0.998).
The SCOPE model used in this study is established under the assumption that ground surface is homogeneous. However, the heterogeneous characteristic of land surface should not be neglected under image pixel scale. Additionally, both SIF and GPP are influenced by a combination of several factors under natural conditions. In this study, we conducted our analysis by varying one impact factor while keeping others constant. Thus, further studies can focus on the analysis of the combined impacts of model parameters.
5. Conclusions
Remote sensing of SIF provides a new observational approach to assess terrestrial GPP. In this study, we found the GOME-2 SIF is consistently related to the MODIS GPP. However, the SIF-GPP relationship would be affected by several factors.
Our analysis revealed the relationship between SIF and GPP is ecosystem-specific, which could be attributed to the ecosystemspecific plant structural and physiological characteristics, as well as the environmental situations corresponded to each ecosystem. We also found the SIF-GPP relationship was affected by LST, which was due to the biochemical process influenced by temperature. Temperature conditions affect both the light reaction and CO2 assimilation processes in photosynthesis while only the former process produce SIF. The mismatch would lead to significant uncertainties. The SCOPE simulations also suggested that the SIF-GPP relationship was complex due to the influence of shortwave irradiance, chlorophyll content and LAI. The simply linear SIF-GPP relationship may be applicable only for certain conditions. We conclude that dedicated strategies are required to compensate for the various factors impacting SIF-GPP relationship before applying SIF as a constraint of global GPP estimate.
Remotely sensed SIF signal is obtained under a certain time determined by the satellites’ pass time. However, GPP represents the amount of chemical energy as biomass that primary producers create in a given length of time. Obviously, the instant SIF signal cannot reflect the accumulated GPP properly due to their mismatch over time. Compared with directly estimating GPP using SIF signal, the development of process-based models is still needed in future researches.
Competing Interests
The authors declare that they have no competing interests.
Author Contributions
All authors contributed extensively to the work. Tianxiang Cui performed the data analysis and prepared the manuscript. Rui Sun designed the main research ideas and helped improved the manuscript. Chen Qiao helped prepared the dataset and run the model used in the study.