


1. Introduction
Aerosols play an important role in the human life not only because their impacts on the air pollution but also their impacts on climate through the radiative forcing from aerosol-cloud interactions (RFaci). Aerosols can serve as cloud condensation nulcei (CCN) and the changes of CCN can impact cloud microphysical properties and then influence the incoming solar energy by changing cloud albedo and atmosphere heating rate by absorbing radiation through the vertical range of their distribution. Twomey [1] indicated that the increase of aerosol concentration could increase low-cloud droplet concentrations with the same cloud liquid water content, then increase cloud albedo and would be a cooling influence.
A bunch of studies have provided convincing evidence of RFaci by using space- and ground-based observations [2-8]. Increase of aerosols could lead to the formation of a large number of small droplets with a low collision rate, thus suppressing the warm rainforming process. The delayed precipitation increases the duration of the diffusion droplet growth stage, increases the latent heat released by freezing since additional water rises to the freezing level and thus impacts the vertical development of clouds. However, the detailed understanding of RFaci and overall net effects is still challenging due to the complexity of the climate system and the inadequacy of measurements and methodologies [9,10]. In the study of Li et al., [11], a strong aerosol invigoration effect on convection in summer was observed, which leads to higher cloud-top heights for mixed-phase clouds with low bases through the analysis of the 10 years measurements of aerosol and cloud properties at US Department of Energy's Atmospheric Radiation Measurements (ARM) Southern Great Plains (SGP) site.
In this study, five years (from 2006 to 2010) ground-based observations of aerosol, cloud properties and meteorological conditions from an atmospheric measurement field station (39.054_N and 76.877_W) at Howard University Beltsville Campus (HUBC) were used. This region experiences frequent episodes of elevated anthropogenic aerosol loading associated with urban pollution conditions during summer months and the air flow across the region under polluted condition is predominantly from west-southwest [12-14]. Li et al., [14] found that in this region, the increase of the polluted aerosols induced the decrease of the cloud droplet effective radius (Re) but the increase of cloud optical depth (COD) and cloud droplet number concentration (Nd) in the summer time. Based on the measurements in the same region, this study investigated aerosols impacts on cloud base height.
2. Measurements
The Howard University Beltsville Campus facility in Beltsville, MD has a wide range of sensors deployed to observe atmospheric radiation, surface fluxes, aerosol, cloud properties and other climate and weather processes [13,14]. Among the cloud properties, LWP is retrieved from brightness temperature observations from a dual frequency (23.8 and 31.4 GHz) Microwave radiometer (MWR) [15]. COD and Re are retrieved by a Nonlinear Least Squares Method with measurements of LWP and diffuse radiation [16,17]measured by a MultiFilter Rotating Shadow band Radiometer (MFRSR) which is a sensor with a shading band that rotates, measuring global down welling irradiance, diffuse irradiance and direct beam irradiance calculated from global and diffuse irradiance. Cloud-base heights are measured by a Vaisala CT25k ceilometer. The CT25k ceilometer which is a single-lens lidar system equipped with a pulsed near-infrared diode laser (905nm) locates within the vicinity of the MFRSR. CT25k ceilometer is fieldproven and popular laser ceilometers for measuring cloud height and vertical visibility. The unique single-lens design provides high signalto- nose ratio for lidar return signals at low altitude which ensures the excellent performance at low altitude that really counts for aviation safety. The measurement range of CT25k ceilometer is from 0 to 7500 m and the vertical resolution is 30 m (CEILOMETER CT25K User’s Guide) [18].
The near surface particulate matter with aerodynamic diameter ≤ 2.5 μm (PM2.5) mass concentrations are used in this study to estimate aerosol loading under cloudy conditions. The PM2.5 mass concentrations are measured by a Met One BAM-1020 (beta ray attenuation monitor) operated by the Maryland Department of the Environment (MDE) station at HUBC site. BAM was shown suitable to measure PM2.5 mass concentrations by Schwab et al. [19] through the intercomparison between BAM, filter dynamics measurement system (FDMS), tapered element oscillating microbalance (TEOM), and federal reference method (FRM). A 31-m micrometeorological tower which locates within 100 feet to the MFRSR, MWR, ceilometer and the MDE station is equipped with Platinum resistance thermometer/relative humidity sensors (model 41382VC, R.M. Young Company, Traverse City, MI, USA), vane wind system (model 05103- 5, R.M. Young Company), pressure sensor (model PTB101B, Vaisala) which can provide measurements of air temperature (T), pressure (P) and relative humidity (U) at 1.5 m above the ground. The lifting condensation level (LCL) which is formally defined as the height at which the relative humidity of an air parcel will reach 100% when it is cooled by dry adiabatic lifting has long been used to estimate boundary layer cloud heights and was determined by using the PTU measurements from the tower [20].
The Mid-Atlantic region experiences the largest variation of aerosol loading due to episodic summertime pollution events and the stronger convection that occurs during summer results in more boundary layer clouds. So in this study, only the summer months (June, July and August) observations are used for the investigation of aerosol indirect effects. Li et al. [11] indicated that the response of cloud vertical structure to the aerosols measured near the ground was the most significant for low-base clouds (cloud-base height < 1 km) and disappeared entirely for cloud-base height greater than 2 km in the summer time. That is because low-base clouds having more likelihood of interaction with surface aerosols. So in this study,only those clouds with cloud-base height lower than 1.5 km were investigated. The choosing of 1.5 km is under the consideration of the general boundary height at DC-Baltimore area during the summer time. Cloud cases are selected based on the criteria used to reduce the uncertainties in the retrieval of LWP, Re and avoid contamination from precipitation and clear-sky in Li et al. [14].
3. Results
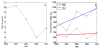
In the previous study of aerosol cloud interaction in the Baltimore- Washington corridor, it was found that more frequent episodes of high aerosol loading occurred and the mean aerosol optical depth (AOD) was higher during the summers of year 2006 and 2007 as compared to that in year 2008, 2009 and 2010 [14]. The similar trend is found on the surface PM2.5 concentration. The decrease trend of PM2.5 from 2006 to 2010 (figure 1a) is in line of the findings from the U.S. Environmental Protection Agency (EPA) report on particle pollution [21] and Hu et at. [22]. The PM2.5 concentrations implied that there were more fine boundary layer aerosols in year 2006 and 2007 than that in year 2008, 2009 and 2010. Same as the previous study [14], the year 2006 and 2007 are denoted as the polluted years and the year 2008, 2009 and 2010 are denoted as the clean years in this study. During the study [14], COD and cloud droplet number concentration were found increasing while the cloud Re decreased during the polluted years. At here, other than the cloud microphysical properties, an increasing trend of the mean cloud-base height from 2006 to 2010 was found (figure 1b) which is opposite to the decreasing trend of PM2.5 (figure 1a). In the meanwhile, no trend is found for the LCLs. The LCL which has long been used to estimate boundary layer cloud heights is typically calculated assuming a well-mixed boundary layer that has a dry-adiabatic temperature profile and a moisture profile with a constant mixing ratio. In this study, the calculated LCL only relies on the near surface meteorological conditions (PTU). Figure 1b shows that the inter-annual variations are similar between the LCLs and the ceilometer detected cloud-base heights although the long-term trends are different. That illustrates that meteorological conditions impact cloud-base height but other than that, there are some other factors impacting the long-term trend of cloud-base height. It is worthy to note that the trend of cloud-base height is opposite to the trend of PM2.5 value over the five years and the PM2.5 trend is independent of the trend of meteorological factors.
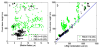
To investigate aerosol impacts on cloud-base height, all cloud cases are segregated based on the instant aerosol measurements. AOD is a good index of aerosol loading in the atmosphere but the measurements of it under cloudy conditions are lack. Instead of AOD, PM2.5 mass concentrations measured by a Met One BAM-1020 are used to indicate the levels of aerosol loading under cloudy conditions. The entire 5 years summer observations of cloud properties (3 minutes average) have been collocated with simultaneously measured PM2.5 and they are segregated into the clean group (PM2.5 <= 10 μg/m3) and polluted group (PM2.5 >= 25 μg/m3). The thresholds are chosen based on the National Ambient Air Quality Standards [23] and the observed PM2.5 concentrations under clouds for all available cloud cases. Cloud cases are selected based on the criteria used to reduce the uncertainties in the retrieval of LWP, Re and avoid contamination from precipitation and clear-sky [14]. Figure 2a shows the relationship between cloud-base height and effective radius during the summer time. It is shown that when the cloud-base height is lower than 1.0 km, the Re is smaller than 10 μm under the polluted conditions and it is scattered from 5 to 15 μm under the clean conditions. When the cloud-base height is higher than 1.0 km the Re is similar for clouds under the polluted and clean cases. Figure 2b shows that the LCLs underestimate the cloud-base height which is consistent with the result in Craven et al. [24]. It is worthy to note that under the same LCLs, the cloud-base heights are lower under the polluted conditions compared to that under the clean conditions. But the difference reduces when the cloud-base height is higher than 1.0 km. Both figure 2a and figure 2b imply that the influence of surface aerosols on cloud Re and cloud-base height become weaker when cloud-base height is higher than 1 km.
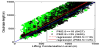
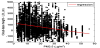
Due to the limited availability of measurements satisfying all the criteria used to reduce the uncertainties in the retrieval of cloud Re and LWP, the sample size was largely reduced. To statistically analyze the variation of cloud-base height, only raining cases are screened out in the following analysis to increase the total available cloud cases during the summer time. Based on the largely increased cloud cases, figure 3 shows that the LCLs underestimate the boundary layer cloud-base height under both the polluted and clean conditions, but the LCLs have smaller errors in the polluted cases compared to the clean cases. That is consistent with the results shown in the figure 2. This means cloud-base height is lower under the polluted conditions than that under the clean conditions when the surface meteorological conditions are the same. But this difference reduces with height and nearly disappears when the cloud-base height is higher than 1 km. Figure 4 shows the variation of the difference between the cloud-base height and lifting condensation level (cloud-base height - LCL) to the variation of PM2.5 concentration for clouds with cloud-base height lower than 1 km. In statistics, a negative relationship with the PM2.5 concentration is found with R=-0.26 and p-value=0.01.
4. Discussion and Conclusions
Aerosol impacts on cloud microphysical properties have been studied for a long time. However understanding of the overall net effects is still challenging due to the complexity of the climate system and the inadequacy of measurements and methodologies. Based on the long-term ground-based observations of aerosol and cloud properties from HUBC facility, this study investigated the potential impacts of aerosols on the cloud-base height.
By cloud formation theory, cloud condensation determines the cloudbase height, which is determined by atmospheric thermodynamics. So boundary layer cloud height was usually estimated using the LCL which is determined by air temperature, pressure and relative humidity. In this study, we found that the LCL underestimated the actual cloud-base height and the underestimation were related to the aerosol loading. When cloud-base heights were lower than 1 km, the actual cloud-base heights were closer to the LCLs and the cloud Re was smaller under the polluted conditions compared to that under the clean conditions. When cloud-base heights were above 1 km, cloud-base heights and cloud Re for the clouds under the polluted cases and the clean cases were similar. That implies the influence of surface aerosols on the cloud microphysical properties is stronger for the low-base clouds which have more likelihood of interaction with surface aerosols.
The statistical study showed that for low-base clouds (cloud-base height lower than 1 km), the actual cloud-base heights were lower under the polluted conditions than that under the clean conditions when the LCLs were the same. That means when the surface meteorological condition is the same, the cloud-base height is lower under the polluted conditions. Opposite to the decreasing trend of the aerosol loading from 2006 to 2010, an increasing trend of cloudbase height was found while there was no such trend found for the LCL. And moreover, a significant negative relationship between the difference of cloud-base height to the LCL and PM2.5 concentration was found based on the five years observations, which supported our hypothesis that the increase of aerosols might decrease cloud-base heights for low-base clouds. This study showed that clouds might form at lower altitude under the polluted conditions compared to the clean conditions. It is a beginning of the investigation of aerosol impacts on cloud-base height, more observations and proofs are needed in the future to study aerosol direct and indirect effects on cloud structures.
Competing Interests
The author declare that there is no competing interests regarding the publication of this article.