


1. Introduction
The climate system is a complex, interactive system consisting of the atmosphere, land surface, snow and ice, oceans and other bodies of water, and living things [1]. Precipitation is one of the most important climate variables. In recent years global precipitation data sets have been developed, but known problems of the stationbased global precipitation data sets include precipitation gauge measurement biases [2,3] and nonuniform station networks [1,4-7]. This causes that precipitation data sets constructed by the interpolation of point estimates to a coarse-resolution grid generally misrepresent precipitation in topographically complex regions due to an underrepresentation of gauge locations at high elevations [7]. This amount of precipitation in topographically complex regions is usually underestimated [7]. The relationship between altitude and rainfall in the tropical and mid-latitude regions such as Himalaya is analyzed by TRMM Precipitation Radar, and the results indicate a strong relationship between altitude and rainfall [8]. In addition, Arctic precipitation estimates from different data sources show a considerable variation [9,10]. A narrowing of the uncertainty of the estimates from several observational sources must be a high priority in the context of model verification [10]. Siberia is one of the areas in the world where observatories are distributed most sparsely according to the Global Surface Summary of Day (GSOD) produced by the National Climatic Data Center (NCDC).
Satellite observations have become a viable alternative to precipitation gauge observations for constructing a globalscale picture of precipitation patterns [11]. Globally distributed, continuous, and high-quality measurements of precipitation have been recently provided by the Global Precipitation Measurement (GPM) as an international satellite mission [12]. High-latitude regions of the eastern Eurasian Continent are blank area of the GPM ground validation site network, and it is expected that the validation site network covers these regions in the future.
The coldest permanently inhabited area on Earth, Oymyakon, is located in eastern Siberia and is one of the areas with a lack of observation sites over the high-latitude mountainous regions. This mountainous area serves a divide between the Arctic Ocean and the Okhotsk Sea river basins. In addition, this terrestrial area is expected to be warmed higher than the global mean during this century, and the amount of annual precipitation is expected to increase as a consequence of a general intensification of the global hydrological cycle [13,14]. The surrounding area belongs to taiga and tundra–steppe transition zone (e.g., [15]), and study of the current status of rainfall over the high-latitude mountainous regions in eastern Siberia, which extends for more than a thousand kilometers, is significant for understanding climate and water systems in upper river basins and runoff into the ocean. It is also necessary to be prepared for possible natural disasters. Therefore, it is important to focus on the rainfall characteristics in sparsely distributed station network in high latitudes. The purpose of this study is to obtain the relationship between altitude and rainfall through ground-based observations in sparsely distributed station network over the high-latitude mountainous regions in eastern Siberia, and to describe the spatial characteristics of rainfall in this area.
2. Methodology
2.1 Standard rain gauge
To measure the total rainfall throughout the year, we made nonrecording standard rain gauges composed of a water-storage part with a water bottle and a water-receiving part with a 60° conical funnel. The diameter of the funnel was 45 mm. One-liter water bottles easily obtainable in eastern Siberia were chosen for the water-storage part. The required rainfall volume of the water-storage part was calculated as 398 mL, assuming that the amount of the annual rainfall in the observation area is 500 mm and the catch ratio of this funnel is 50%; therefore, a 1-L bottle is suitable to use in this area.
A small amount of oil was poured into the standard rain gauges to prevent the evaporation of precipitation caught in the water-storage part. The caught precipitation is mainly rain because the catch ratio of a gauge of this funnel type is poor for snow [16,17]. We assume that the water-receiving part of the funnel is blocked by solid precipitation during winter, and melted solid precipitation flows into the waterstorage part after winter.
2.2 Observation area and term
Standard rain gauges were installed at six sites from the Suntar Khayata Range to Oymyakon in August 2004 and were collected in September 2005 (Figure 1). In addition, other standard rain gauges were installed at 12 sites along the Kolyma Highway from Magadan to Agayakan in September 2006 and were collected in September 2007 (Figure 1).
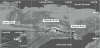
Latitude and longitude were measured with a lightweight, handheld, high-sensitivity GPS receiver. The ASTER Global Digital Elevation Model (ASTER GDEM) was used to obtain the altitude data of the installed sites.
2.3 Catch ratio of the funnel
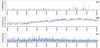
It is widely recognized that the amount of gauge-measured precipitation includes systematic errors that are mainly caused by its wind-induced loss. The catch ratio of the Russian Tretyakov gauge for rainfall at a wind speed of 5.0 m/s is 0.88 [18]. The measurement of snowfall is far more difficult than the measurement of rainfall [17]. In addition, the catch ratio of precipitation gauges depends on the type of gauge such as physical features [17,19]. To estimate the catch ratio of the funnel installed in the sparsely distributed station network over the high-latitude mountainous regions in eastern Siberia, the same standard rain gauge was installed at the site in the Kitami Institute of Technology (KIT), Kitami, Hokkaido, Japan, for 277 days from 1 January 2005 to 5 October 2005. The amount of hourly rainfall, hourly air temperature and hourly wind speed data were obtained by the Kitami site of the Automated Meteorological Data Acquisition System (AMeDAS) operated by the Japan Meteorological Agency (JMA), as shown in Figure 2. Kitami is located at the longitude almost same as study area in eastern Siberia and one of the colder places in Japan, with 763.6 mm amount of annual rainfall, 6.1°C annual mean air temperature, 1.8 m/s annual mean wind speed, and 820 mm maximum snow depth.
The amount of the hourly rainfall captured by the Kitami AMeDAS was corrected using the following formula:
where Rcorrected_AMeDAS is the amount of the corrected hourly rainfall by the Kitami AMeDAS (mm), RAMeDAS is the amount of the hourly precipitation in an hourly air temperature above 0.0°C by the Kitami AMeDAS (mm), CRAMeDAS is the catch ratio of the precipitation gauge used in the Kitami AMeDAS, m is the coefficient depending on the gauge type (=0.0192 of AMeDAS gauge type RT-4 from January 1 to June 3 and 0.0454 of AMeDAS gauge type RT-1 from June 3 to October 5 by [20]), Uestimated_AMeDAS is the estimated hourly wind speed at the height of the precipitation gauge by the Kitami AMeDAS (m/s), uAMeDAS is the hourly wind speed by the Kitami AMeDAS (m/s), zp_AMeDAS is the height of the precipitation gauge by the Kitami AMeDAS (=1.5 m), zo is the roughness (=0.00014 m by [21]), and zu_AMeDAS is the height of the wind gauge by the Kitami AMeDAS (=14.7 m).
To estimate the catch ratio of the funnel, the amount of the corrected rainfall by the Kitami AMeDAS was compared with the amount of the rainfall by the standard rain gauge installed at the KIT site. The catch ratio of the funnel CR was calculated using the following equations:
where RKIT is the total amount of the rainfall during the observation period at the KIT site (mm), WKIT is the volume of the rainfall caught by the standard rain gauge with the funnel at the KIT site (mm3), OKIT is the volume of oil poured in the standard rain gauge to prevent evaporation at the KIT site (mm3), and SKIT is the volume equivalent to solid precipitation caught by the standard rain gauge at the KIT site (mm3). OKIT is estimated at 25,000 mm3. Because it was confirmed by visual observation that the funnel was filled with snow during the winter, and it melted into the water-storage part of the standard rain gauge in spring, to be conservative, SKIT was estimated as ice with a 917 kg/m3 density with which the water-receiving part with the 45-mm, 60° conical funnel was filled, that is, the water equivalent of 19 mm3 and equal to 1.2-mm solid precipitation in a receiving funnel.
2.4 Correction of the standard rain gauge
In this study, we focus our attention on rainfall. Because the wind speed at the height of the stand rain gauge installed over the highlatitude mountainous regions in eastern Siberia is unknown, we take into account the catch ratio CR which is involved in the effect of wind-induced loss based on the field observation at the Kitami site. The CR is assumed to be constant as first approximation. The amount of corrected rainfall Rcorrected (mm) for the six installed sites from the Suntar Khayata Range to Oymyakon and the 11 sites along the Kolyma Highway from Magadan to Agayakan were calculated using equations (6) and (7):
where R is the total amount of the rainfall measured by the standard rain gauge installed over high-latitude mountainous regions in eastern Siberia (mm), W is the volume of the rainfall caught by the standard rain gauge (mm3), O is the volume of oil poured in the standard rain gauge to prevent evaporation (mm3), and S is the volume equivalent to solid precipitation caught by the standard rain gauge assuming that the water-receiving part with the funnel is filled with ice (mm3).
3. Results and Discussion
3.1 Collection of standard rain gauges
While being collected, the standard rain gauge installed in the neighborhood of the boundary of Magadan Oblast and Sakha Republic in the Kolyma River basin was found to have been damaged. Hair follicles were stuck to the damaged rain gauge; therefore, the damage was presumed to be caused by a wild animal. A plan to install several gauges in the same vicinity is necessary in places where damage by animals can occur. The undamaged gauges were used for analysis in this study.
3.2 Catch ratio
The amount of the corrected rainfall by the Kitami AMeDAS, Rcorrected_AMeDAS, was 449.3 mm. The amount of the corrected rainfall by the standard rain gauge installed at the KIT site, RKIT, was 310.0 mm. Finally, the catch ratio of the funnel, CR, was calculated to be 0.690.
3.3 Altitude dependence
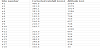
Table 1 shows the amount of the corrected rainfall by the standard rain gauges installed over the high-latitude mountainous regions in eastern Siberia and the altitude at the observation sites. As shown in Figure 3, the amount of the corrected rainfall in these areas depends on altitude and that the amount of the rainfall increased slightly with an increase in altitude. To investigate the altitude dependence of rainfall over high-latitude mountainous regions in eastern Siberia, a linear equation as a function of altitude H (m) was fitted as

Rcorrected = aH + b
where a is the increased ratio of the amount of rainfall due to altitude (mm/m), and b is a constant (mm).
The amount of the corrected rainfall in the Indigirka River basin, including glacial terrain, during August 2004 through September 2005, Rcorrected_ir0405, is plotted against altitude in Figure 3(a). The data points were subjected to least-squares fitting. The following relationship between the altitude and the rainfall was obtained.
Rcorrected_ir0405 = 0.158H + 76.4
The increased ratio of the amount of rainfall due to altitude was 0.158 mm/m within an altitudinal difference of 1,397 m. The Indigirka River basin includes the glacial terrain located at an altitude of approximately 2,000 m. Results clearly show that the amount of the corrected rainfall depends on altitude and that the rainfall increased slightly with an increase in altitude.
The amount of the corrected rainfall in the Indigirka River basin, Rcorrected_ir0607, the Kolyma River basin, Rcorrected_kr0607, and the surrounding Okhotsk area, Rcorrected_so0607, during September 2006 through September 2007 are plotted against altitude in Figure 3(b), Figure (c), and Figure (d), respectively. The relationship between altitude and rainfall in the Indigirka River basin, Kolyma River basin, and surrounding Okhotsk area was obtained as follows:
Rcorrected_ir0607 = 0. 048H + 183.6
Rcorrected_kr0607 = 0.267H + 180.1
Rcorrected_so0607 = 0.500H + 315.7
The increased ratio of the amount of rainfall in the Indigirka River basin in 2006/2007 due to altitude was 0.048 mm/m within an altitudinal difference of 179 m. The increased ratio of the amount of rainfall in the Kolyma River basin in 2006/2007 due to altitude was 0.267 mm/m within an altitudinal difference of 435 m. The increased ratio of the amount of rainfall in the surrounding Okhotsk area in 2006/2007 due to altitude was 0.500 mm/m within an altitudinal difference of 408 m. To investigate the relationship between altitude and rainfall, we divided the sites obtained the amount of rainfall in this study into every basin and analyzed it. Then, there is the basin (surrounding Okhotsk area) where there is not much number of the rainfall data. We believe that the increase in number of the data in the future should make our conclusion sounder.
In this study the amount of rainfall in Figure 3 decreases, except for glacier terrain , as advancing from the nearby coast (surrounding Okhotsk area ) to the inland (from Kolyma River basin ◆ to Indigirka River basin ■). From the result that compared global maps of annual precipitation for sensors of AMSR2 (Advanced Microwave Scanning Radiometer 2), GMI (GPM Microwave Imager), MHS (Microwave Humidity Sounder) and SSMIS (Special Sensor Microwave Imager/ Sounder), the precipitation of the neighborhood of coast shows the tendency that there is slightly many [22], and this is consistent with our results.
In addition, positive altitude dependence (that is, the amount of rainfall increases with an increase of altitude) is seen in each basin in this study if basins are different although the amount of rainfall is different at the same altitude, as shown in Figure 3. And the altitude dependence in Figure 3 is different every basin. As for this, according to the precedent study using satellite observations, the altitude dependence of rainfall has been examined in some areas using TRMM (Tropical Rainfall Measuring Mission)/PR (Precipitation Radar), and the results show that the amount of rainfall increases with altitude and the increased ratio of the amount of rainfall due to altitude is various by an area [23]. Our results at sparsely distributed station network over the high-latitude mountainous regions in eastern Siberia shows that the increased ratios of the amount of rainfall due to altitude are different every basin, as shown in Figure 3. This is consistent with the increased ratio being different by an area.
We clearly found that the amount of the corrected rainfall in these areas is dependent on altitude, and the rainfall amount increased slightly with altitude. The weak positive altitude dependence on rainfall was confirmed even in the eastern Siberian mountains.
Precipitation over and near mountains occurs when storms of a type that can occur anywhere (deep convection, fronts, tropical cyclones) form near or move over complex terrain [24]. Based on an isotope analysis, the westerly moisture transport is mainly strong over Russia, and westerly moisture flux decreases because of precipitation as a distance from the coast increases [25]. In addition, marine moisture at coastal stations near the Pacific and Arctic oceans is a local source for precipitation [25]. Based on a synoptic-scale analysis using reanalysis data, the water vapor origin in this area was often the Okhotsk Sea [26]. Therefore, it seems reasonable to suppose that a source of rainfall in this area is affected from the nearby coast, the Okhotsk Sea. The relationship between the obtained increased ratios of the amount of rainfall and the distance from a nearby coast (the Okhotsk Sea) is represented in Figure 4. The least-squares fitting method was applied to the data points with the arithmetic mean for each basin during September 2006 through September 2007, except for those data from August 2004 through September 2005.
a = -0.001D + 0.545
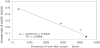
It is important to note that the increased ratio of the amount of rainfall due to altitude a (mm/m) decreases almost linearly with an increase in the distance from the nearby coast D (km). The Verkhoyansk Range is located in the western part of this study area. Thus part of supply of the westerly moisture is interrupted. As the distance from the nearby coast of the Okhotsk Sea is shortened, supply of the moisture as a source of rainfall in this area increases. Therefore, based on ground-based observations, the increased ratio of the amount of rainfall due to altitude a (mm/m) depends on a distance from the nearby coast.
4. Conclusion
As noted in the introduction, the goal of the present study was to obtain the relationship between altitude and rainfall in sparsely distributed station network over the high-latitude mountainous regions in eastern Siberia through ground-based observations using standard rain gauges. The standard rain gauge was composed of a water-storage part with a water bottle and a water-receiving part with a funnel. From a comparison between the rainfall results in the KIT and Kitami AMeDAS sites, the catch ratio of the standard rain gauge was estimated as 0.690. Using the obtained catch ratio, the relationship between altitude and rainfall was investigated, and results clearly show that the amount of the corrected rainfall in these areas depends on altitude and that the amount of the rainfall increased slightly with an increase in altitude. Using global digital elevation data, these relational expressions of rainfall as a function of altitude, such as equations (9)–(13), will be useful to estimate the rainfall distribution in areas where observatories are sparsely distributed, including the eastern Siberian mountain regions. To describe the spatial characteristics of rainfall in this area, the relationship between the increased ratio of the amount of rainfall due to altitude and the distance from the nearby coast was investigated. It is important to note that based on groundbased observations the increased ratio of the amount of rainfall due to altitude decreases almost linearly with an increase in a distance from the nearby coast (the Okhotsk Sea) originating moisture of a source of rainfall. It is critical to understand precipitation on the global scale in order to determine the likely changes of precipitation patterns in a warming world [24]. The results described in this paper have provided some insight into the interactions between important orographic components of the precipitation system at sparsely distributed station network over the high-latitude mountainous regions in eastern Siberia.
Acknowledgments
The authors are grateful for the helpful comments provided by the editor and anonymous reviewers. ASTER GDEM is a product of METI and NASA. This research was partially supported by a Ministry of Education, Science, Sports and Culture Grant-in-Aid for Scientific Research (B), 16403006, 2004-2007, Glaciological observations in Eastern Siberia as an activity of IPY project entitled "Glaciological research in Suntar Khayata Range, East Siberia, Russia, for International Polar Year" (ID No. 393).