


1. Introduction
Approximately 7.1 billion mobile phones are in use globally [1]. While mobile phones are not designed to be diagnostic devices and their data does require special processing, their ability to reach billions of remote and underserved people, directly or through caregivers, dwarfs all other channels available to medical diagnostics. A successful phone-based test for Covid-19 would allow population health managers to map prevalent cases and geographic progression of the disease. It would provide a practical approach to evaluating individuals in high-risk locations such as places of work, entertainment venues, and in transit systems. It would allow clinicians to triage and monitor patients remotely. It would allow individuals to evaluate themselves, and their social contacts, repeatedly, inexpensively, and easily. The opportunity presented by using ordinary cell phones to detect Covid-19 is not to replace existing diagnostic technologies but, rather, to extend testing to situations where no other practical options exist.
Tele-stethoscope uses phone voice recorders to capture acoustic data from body sites much like traditional stethoscope examinations. In this study, the focus is on respiratory acoustics captured above the collarbone. As with traditional stethoscopes, Tele-stethoscope is non-invasive, in expensive and the results are available immediately. Tele-stethoscope uses a novel analytical approach based on computational fluid dynamics (CFD), which is a form of applied physics [2]. It differs from machine learning which, in auscultation studies, typically relies on transforms, statistics, and deep learning [3]. Tele-stethoscope seeks to maximize the use of equations associated with known physical laws. In doing so, Tele-stethoscope’s aim is to maximize data utilization efficiency, model utility and results reproducibility.
In earlier unpublished research, Fleming Scientific experimented with coughs and other respiratory cycles but found that egophony produced the best signals for Tele-stethoscope. Egophony is a traditional auscultation technique that uses vowels and other key sounds in conjunction with stethoscopes to detect, for example, pleural effusions [4]. Pleural effusions are a build-up of excess fluid around the lungs. In the Tele-stethoscope protocol, patients are asked to say and hold the letter “E” for a few seconds and then repeat. The purpose of egophony in the Tele-stethoscope protocol is not diagnostic per se but, rather, to help patients to create a stable airflow that can then be analyzed in terms of the CFD model.
2. Clinical Recruitment & Methodology
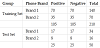
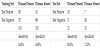
The study was conducted in a hospital environment from May to July, 2021 under an IRB. All patients in the study were admitted to the hospital for consultation or treatment of some non-traumatic condition that may, or may not, have been respiratory in nature. All patients were tested with CoviPath™-19 RT-PCR Kit or equivalent and then recorded subsequently with one of two android phone brands. Note that the negative testing patients were not otherwise of normal health, per se, and that information regarding their medical history and tobacco use was unavailable. Note, too, that the patients testing positive were recorded, in some cases, after receiving treatment and some had exhibited partial recovery from Covid-19. In a few cases, patients were unable to hold vowel sounds for more than the 1-2 seconds necessary for analysis. Those recordings were excluded from the study. The remaining cases were then randomly sampled into a set of 260 cases, which was the largest sample that could be constructed with balanced cells (summarized in Table 1). A training set (210) and a test set (50) were then randomly selected from these 260 cases. In order to standardize the recording format, the two phone brands employed used the same free open-source voice recorder application which was downloaded from the internationally accessible Google Store. As no significant differences in results were observed across the two phone brands, the data was combined for analysis.
3. Sound Verification
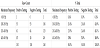
As mobile phones are not traditional auscultation devices, an important first step was to verify that the recorded sounds were within literature ranges for egophony “E” acoustics. The literature is not in agreement regarding normal egophony “E” ranges with values varying from 1-200 Hz [4] to 1-400 Hz [5]. In Table 2, the maximum frequency in each recording was grouped by frequency range. Note that 89% fell in the 1-400 Hz range with little differences in distribution between Covid-19 positive and negative patients. With one exception, the remaining 11% fell in the adjacent 401-605 Hz range which is where plural effusions are observed in traditional egophony [4]. As pleural effusion is uncommon with Covid-19 [6], the observed similarity between positive testing and negative testing patients on a frequency distribution basis was not unexpected. Overall, the distribution of recorded frequencies, shown in Table 2, is in line with expectations based on literature review of egophony “E” acoustics and validates the use of ordinary phones to record them above the collarbone.
Sound frequency analysis alone, however, offers little insight into the underlying airflow dynamics. One way to visualize these dynamics is to use a technique called Delayed Coordinate Embedding [7] originally developed in the study of turbulent flow and chaos. It involves plotting a time series, in this case sound, against a time lagged version of itself in order to illuminate dynamics that can be difficult to perceive in other domains.
Figure 1 illustrates the use of this technique with two typical patients from the study, one testing positive for Covid-19 and the other testing negative. Here, the raw sound is plotted at left in time domain. Each patient’s effort to say and hold “E”, twice, is clearly visible. At right, a short segment of each of these recordings is then plotted by using Delayed Coordinate Embedding. In this type of view, periodic patterns or cycles within the data should emerge as elliptical patterns.
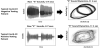
In both of these cases, visualization of patients saying “E” gives rise to two separate cycles. In the Covid-19 negative testing case, the cycles are smooth and composed of hundreds of nearly parallel variations. These “unstable periodic cycles” are a common property of chaotic or turbulent systems (Takens, 1981) and well characterized by our CFD. In the Covid-19 positive testing case, however, these cycles are very visibly rough and indicative of aperiodic flow. In short, the airflow dynamics of these two patients are visibly different and well appreciated by our analytical strategy.
4. Results
Tele-stethoscope analysis of the 210 training set recordings produced 398 descriptive physical markers. In order to optimize the selection of these markers, a metaheuristic method was used to maximize an optimization function that was defined to be the sum of sensitivity and specificity (across the training set). The metaheuristic method optimized the function only by selecting combinations of the 398 markers but not by weighting them. In the optimized solution, the 398 markers were reduced, unweighted, to 52 markers that were simply scaled and added together to form the final diagnostic model. Subsequent attempts to improve the solution by allowing the metaheuristic to weight the markers did not, in fact, produce a better solution. As the metaheuristic process approximates maximum entropy process [8], it naturally produces a sigmoid distribution, as is shown in Figure 2, allowing it to be used directly as the diagnostic model or classifier.
The analysis is analogous to logistic regression. However, instead of using regression to fit the sigmoid’s exponential coefficient from raw data, physical markers are calculated from the same raw data and simply scaled and summed together without weighting. Both processes have the same intent but the Tele-stethoscope approach has two advantages in this application: 1) the physical basis of the model is maximized and 2) the non-linear boundaries in the data are easier to manage.
The model’s performance in the train and test sets is summarized in Table 3. Among the test set, the diagnostic model achieved 83.8% sensitivity and 84.8% specificity. Among the test set, it achieved 80.0% sensitivity and 72.0% specificity.
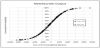
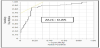
The Receiver Operating Characteristic (ROC) curve was then calculated from the sum of the unweighted 52 markers and it is shown in Figure 3. The Area Under the Curve (AUC) was calculated to be 0.85. AUC is a measure of the ability of a model to classify correctly, with 1.0 being perfect classification.
5. Discussion
In this study, a technology for detecting Covid-19 was evaluated that uses ordinary mobile phones to capture egophonic signals above the collarbone, subsequently analyzing them with a dynamics based approach. The purpose of developing such a technology is not to replace gold standard testing but, rather, to make testing available to billions of patients and in countless situations where no other practical options exist. Although Tele-stethoscope is designed to be used with mobile phone captured data, it can also process data from digital stethoscopes for use in applications where these devices are available.
An important first step in the study was to verify that the protocol was capable of reliably capturing appropriate respiratory signals. Results were in line with expectation. The second step was to determine the feasibility of creating a diagnostic model for Covid-19 based on fluid dynamics analysis. Results were encouraging even though three factors limited the performance of the test set. First, the total sample size was small. Second, some of the positive testing patients were exhibiting recovery at the time they were phone recorded. Third, the negative testing patients were not otherwise “healthy” per se and some possibly had abnormal respiratory function.
At this stage, three unknowns remain. First, nothing can be concluded in terms of how early Covid-19 could be detected, or if severity could be predicted, by Tele-stethoscope. Second, while results showed no difference between the two phone brands used, it is unknown how well a large number of phone brands could be served by a single model. Third, the ability of medically untrained patients to self-test was not evaluated.
Literature search identified a few important references listed below. Statistical analysis of vowels in speech is shown to produce effective Covid-19 markers [9]. Smartphones are shown to perform successful heart auscultation [10]. Smartphones are shown to perform successful lung auscultation [11]. Tele-stethoscope has been shown to reproduce key echocardiogram parameters by using ordinary phones [12]. Tele-stethoscope appears to be novel in its use of egophony technique in conjunction with CFD modeling for phone-based detection of Covid-19.
In a clinical trial, a much larger sample should be recruited and some cells should involve patient self-testing outside of the hospital environment. A much larger selection of phone brands should be used and health history, including tobacco use, should be considered. Also, phone recording and PCR kit testing should be performed in the same time frame. As an augment, a Tele-stethoscope cardiac test could be added to map ventricle dysfunction which has been shown to be present with Covid-19 [13]. In US clinical study, Tele-stethoscope has shown the ability to reproduce echocardiogram heart failure parameters [12], also with ordinary mobile phones.
6. Conclusions
The results of this study support the feasibility of using ordinary (unmodified) phones to detect Covid-19 by using Tele-stethoscope technology. Although it should be noted that the study was conducted in a hospital environment and by medically trained staff. If comparable performance can be achieved in field applications, the technology could be a viable and cost-effective way to make testing available to billions of remote and underserved people. It could significantly impact both personal and public health management of the disease in many developing countries and rural areas.
In this study, Tele-stethoscope detected Covid-19 by mapping respiratory airflow with a novel fluid dynamics approach, rather than by using more common machine learning. The same approach could possibly be successful in mapping other infectious diseases, chronic conditions and trauma that present in respiratory acoustics. If so, the technology could function as a broad-based screener for people or in situations where other technologies are not available.
Competing Interests
The authors declare that they have no competing interests.
Acknowledgments
The authors wish to thank Navaneet Dutt, whose vision and tireless efforts made this research possible.
Footnotes
Tele-stethoscopeA is a proprietary technology developed by Fleming Scientific in 2019, US patent and trademark registration pending. In parallel US clinical study, Tele-stethoscope has shown the ability to estimate cardiac ejection fraction and stroke volume using only mobile phones [12]. In, as yet, unpublished research, it has also shown the ability to detect COPD from traditional stethoscope recordings.
Publisher's Note
All claims expressed in this article are solely those of the authors and do not necessarily represent those of their affiliated organizations, or those of the publisher, the editors and the reviewers. Any product that may be evaluated in this article, or claim that may be made by its manufacturer, is not guaranteed or endorsed by the publisher.