


1. Introduction
Insulin resistance and beta cell dysfunctions are two most important underlying defects of type 2 diabetes (T2DM) [1]. They start to deteriorate long before the clinically significant T2DM could be noted [2]. In fact, more than 50% of beta cell function is lost before hyperglycemia developed [3-5]. There are two phases of insulin secretion, i.e. the first- and second phase insulin secretion (FPIS, SPIS, respectively) [6,7]. Previous studies showed that the FPIS is lost in the early stage of T2DM but the SPIS is only blunted [8,9]. However, the responses or recovery of these two phases of insulin secretion after treatment have never been well studied.
This study was conducted to evaluate the change of insulin secretion before and after treatment in newly diagnosed T2DM. Both FPIS and SPIS will be evaluated by FSIGT and M-LDGGI test, respectively.
2. Method
2.1 Subjects
Newly diagnosed T2DM patients aged between 40-70 years old in our out-patient clinic were invited to participate in this study during 2001 to 2005. They visited our clinic originally for a routine check up for diabetes. After enrolled, all participants had a complete routine physical examination to exclude subjects with history of diabetic ketoacidosis, cardiovascular, respiratory, renal or other endocrine disorders [10-16]. The diagnostic criteria for T2DM were based on the 1997 American Diabetes Association criteria with a fasting plasma glucose (FPG)= 126mg/dl (7 mmol/dl) [17]. They did not take any medications known to effect of insulin sensitivity and/or beta-cell function during the study period except the medications we prescribed. Three days prior to the study, patients were put on a stable diet. Written informed consent was obtained from each individual, and the study was reviewed and approved by the Institutional Review Board.
All the study cases were put on either gliclazide or repaglinide randomly. The doses of the medications were then adjusted until the fasting plasma glucose (FPG) was below 7.7 mmol/l or until the maximum dose were reached (gliclazide 120 mg or repaglinide 6 mg per day). Subjects needed a second medication to control the FPG were excluded from the study. The treatments were maintained for three months.
2.2 Anthropometric measurements
The body height and weight were recorded to the nearest 0.5cm and 0.1 kg, respectively. Body mass index (BMI) was derived from body weight divided by the square of body height in meters. Waist and hip circumferences were measured in standard way to the nearest 0.1cm. Waist to hip ratio (WHR) was calculated by divided waist by hip circumference. Subjects were seated with leg uncrossed and were asked to refrain from talking for 10 min before blood pressure and heart rate measurement were taken.
2.3 Procedures of tests
Each participant undertook the M-LDGGI and FSIGT before antidiabetic therapy and then repeated both tests after the treatment. The tests were performed at 0800 following a 10-h overnight fast on different day with at least a three-day interval between each test. On the test day, participants were in a sitting position and an intravenous catheter was placed in each forearm; one for blood sampling and the other one for glucose infusion. The sampling catheter was kept patent by slow infusion of 0.9% saline.
FSIGT: After the catheters were placed, a bolus of 10% glucose water (0.3 g/kg) was given. Another bolus of regular human insulin (Novo Nordisk Pharmaceutical, Princeton) 0.05 units/kg was injected 20 minutes after glucose load. Blood samples for plasma glucose and insulin levels were collected at 0, 2, 4, 8, 19, 22, 30, 40, 50, 70, 100, 180 minutes. They were put into Bergman’s Minimal Model [18] and then the insulin sensitivity (SI), glucose sensitivity (SG) and acute insulin response to the glucose load (AIRg) were obtained.
M-LDGGI: The catheters were placed as the FSIGT and a stepped intravenous infusion of glucose (20% dextrose) was then started at a rate of 2 mg/kg/min, followed by 6 mg/kg/min. Each infusion rate was maintained for 80 min and blood samples were drawn at a 20 min interval for the measurement of plasma insulin and glucose levels. The results were interpreted as the slope of the changes of plasma insulin levels (y-axis) against the plasma glucose levels (x-axis). The slopes of these curves were regarded as the SPIS.
2.4 Laboratory assays
The blood samples were centrifuged immediately and stored at –30C° until time of analysis. Plasma insulin was measured by a commercial solid phase radioimmunoassay kit (Coat-A-Count insulin kit, Diagnostic products Corporation, Los Angles, CA, USA). Intra- and –inter-assay coefficients of variance for insulin were 3.3 and 2.5%, respectively. Plasma glucose was measured by a glucose oxidase method (YSI 203 glucose analyzer, Scientific Division, Yellow Spring Instrument Company Inc., Yellow spring, OH, USA). Serum total cholesterol (TC), triglyceride (TG), and high-density lipoprotein cholesterol (HDL-C) were measured by the dry, multilayer analytical Slide method in the Fuju DR-Chem 3000 analyzer (Fuji Photo Film Corporation Minato-Ku Tokyo, Japan). The level of hemoglobin A1c (A1C) was evaluated by ion-exchange high pressure liquid chromatography (HPLC) method (BIO-RAD VARIANT II, USA). The calculations of homeostasis model assessment for insulin resistance (HOMA-IR) and HOMA-B were calculated according to Matthew’s equations.
2.5 Statistical analysis
All variables were summarized as means and standard deviation (SD) in S.I. units. Plasma insulin/glucose slope, SI, SG, AIRg, HOMAIR and HOMA-B were expressed as median and 25th, 75th interquartile range. The distributions of continuous variables were examined by the Shapiro-Wilk test. The variables were transformed to fit normal distribution for analysis if possible. The paired Student’s t tests and Chi square tests were used to identify the differences in various demographic and metabolic characteristics in subjects before and after treatment. Signrank tests were used to compare plasma insulin/glucose slope, SI, SG, AIRg before and after treatment since normal distribution could not be achieved by transformation. All participants were further divided into responders and non-responders arbitrarily according to the change of plasma insulin/glucose slope. In other words, subjects with better improvements (upper 50%) were regards as responders. According to the nature and distribution of the independent Student’s t tests, Chi square tests and ranksum tests were applied to evaluate the difference between these two groups. Stepwise multivariate linear regression models and partial correlation coefficients were used to analyze the association between the changes of plasma insulin/glucose slope with various characteristics. Age and gender were regarded as potential confounders and were adjusted. A two tailed p-value below 0.05 was considered significant. Stata/SE 10.0 for Windows (StataCorp LP, TX) was used for statistical analyses.
3. Results
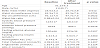
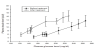
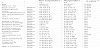
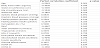
A total of 27 drug naive T2DM patients (11 men, 16 women) were enrolled in this study. The demographic features before and after the treatments are shown in table 1. Not surprisingly, the BMI, hip circumference, diastolic blood pressure were higher while FPG and A1C were lower after treatment. However, the increased HDL-C was not expected. Table 2 shows different parameters of insulin action and secretion before and after treatment. Again, the improvement of FPIS, SPIS and HOMA-B were expected. However, the changes of FPIS were not statistically significant. The graphic illustration of the SPIS before and after treatment is shown in figure 1. It could be noted that the response of insulin after glucose challenge improved significantly.
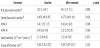
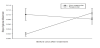
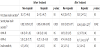
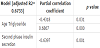
According to the changes of the SPIS, we arbitrarily divided the study subjects into two groups as aforementioned in the method, the responders and non-responders. The changes of the SPIS of these two groups before and after the treatments are shown in figure 2. Table 3 and table 4 show the metabolic characteristics and the parameters of insulin action of these two groups before and after treatment. The non-responders were older, had higher BMI, waist circumference and lower FPG, A1C than the responders. Interestingly, the HOMA-B was significantly improving in the responders while the FPIS showed no difference between these two groups neither before nor after treatment. To further determine which factors are more related to the difference between the SPIS before and after treatment (d-SPIS), partial coefficient correlation was applied after adjusting age and gender. The d-SPIS was negatively correlated with age, BMI, waist circumference, d-A1C, baseline SPIS, and positively correlated with A1C and TG (Table 5). Finally, when putting all these significant factors into the multivariate linear regression model, age, baseline SPIS were negatively and TG was positively related to the d-SPIS (Table 6).
4. Discussion
After treatment, several interesting points concerning insulin sensitivity and secretion were noted in this study. First, the SI remained unchanged even though the A1C improved dramatically. This result is similar to the present consensus that when clinical apparent T2DM has occurred, the SI already reaches to its lowest level and cannot be corrected or improved [19]. Other than the SI, the change of insulin secretion is also interesting. From table 2, it could be noted that FPIS, SPIS and HOMA-B were all improved after treatment although the change of FPIS was not statistically significant. Again, this finding is consistent with previous studies [20,21].
The fact that obese subjects have better insulin secretion has been shown in many different studies. For example, in a 9-year follow-up of a non-diabetic Japanese population comprise 1788 subjects, Kosaka et al found that among those who develop diabetes, the baseline insulinogenic index was lower in non-obese subjects but relatively preserved in obese subjects [22]. Even they used less accurate method – oral glucose tolerance test, these findings still suggested that better insulin secretion could be noted in obese subjects. Our group also showed, by using intravenous glucose tolerance test, that the obese young subjects with T2DM had better FPIS compared to their nonobese counterpart [23]. To our knowledge, very few researchers had investigated the role of BMI on the SPIS. Contrary to these studies, our results showed that subjects with higher BMI were non-responders. This paradoxical finding could be explained by the fact that the lower body weight of responders might be due to higher blood glucose levels and, thus, had better recovery after the treatment. This recovery included both blood glucose and BMI. In the same time, the impact of BMI on the insulin secretion should not be as significant as it was in other studies since the mean of BMI were around 25 kg/m2 and there was only 0.7 kg/m2 difference between these two groups. This hypothesis was further supported by the findings of the multivariate regression which showed that the BMI is not significantly correlated with d-SPIS after adjusted for other confronting factors.
The changes before and after treatment of the HOMA-B, FPIS and SPIS (d-HOMA-B, d-FPIS and d-SPIS, respectively) are interest but also the important goals in this study. Although the d-FPIS of both groups had been increased, however, they did not reach statistical significance (Table 4). In the meanwhile, d-HOMA-B only improved significantly in the responders, which is similar to the finding of d-SPIS. Taking all these together, it could be concluded that subjects with lower baseline levels would have better improvement. In table 5, all factors that were considered to be correlated with the d-SPIS were evaluated by simple correlation after adjusted for age and BMI. The correlation were significantly negative in age, BMI, d-A1c, baseline SPIS, HOMA-B and positive in A1c, TG as aforementioned. However, when putting all these factors into the multivariate regression model, only TG was positively, age and SPIS were negatively related to the d-SPIS. Our hypothesis for these negative correlations is that when those younger subjects in this study had diabetes, they had impaired SI which was as severe as the elder counterparts. This relative serious derangement of the glucose metabolism made their blood glucose levels higher and, thus, further lowered BMI and SPIS due to glucotoxicity. However, after the treatment, they had better d-SPIS and it is highly possible due to their young age and better recovery ability. In the future, to further understand the relationships between these factors, the age of the study subjects should be limited to a narrow range. This would reduce the effect of age on the insulin secretion.
Finally, the positive correlation between TG and d-SPIS was not expected. However, Unger et al. had already showed that the ‘lipotoxicity’ could also have an adverse effect on the insulin secretion [24,25]. Increased oxidative stress and subsequent damage of pancreatic islet cells could be the possible pathophysiologies [26,27]. Our study is the first one to demonstrate the important role of TG in the insulin secretion, especially the SPIS.
There are limitations in this study. First, the study cohort was small. However, if significances could be noted in this size of the cohort, it indicates that that these relationships do exist. Secondly, our method is the ‘modified’ LDDGI and the C-peptide was not measured. But since the M-LDDGI lasted for 160 minutes and thus it was long enough to be curtained that it was the SPIS being measured. In the meanwhile, the majority of researches focusing on the insulin secretion did not neither measure the C-peptide nor use the deconvolution method. We believe that the results in our study are still informative and reliable.
In conclusion, in fresh type 2 diabetes, younger subjects with higher A1C would have lower SPIS. After the treatment, the SPIS would be better improved than older subjects. In the meanwhile, subjects with higher TG will have better d-SPIS.