


1. Introduction
When a researcher starts a new research project, it is crucial to find a suitable researcher who is similar to his/her own research field in order to improve the outcome of his/her own research. The stepping stone to this is looking for papers. However, owing to the increasing number of papers published annually, it is difficult for reserchers to find a paper in the field they want to study. Recently, various paper search services can help reserchers find appropriate papers by references or keywords in the paper [1]. However, when searching for papers, it is difficult to identify the connections between authors. Because relatively similar studies often involve the same authors, the co-authorship provides useful information for improving paper search. By predicting future co-authorship, we can identify connections between authors that we could not see before, as well as search for papers written by authors in similar fields to the author of the paper.
In addition, when they conduct collaborative research, it is crucial to find appropriate researchers who are familiar with their research field to improve the outcome of the research. However, in recent years, owing to the popularity of multidisciplinary research, it is difficult for reserchers to find an appropriate researcher in their field.
Therefore, in order to find collaborators, we predict future co-authorships based on past co-authorships, reserch fields, and published papers.
Several previous studies predict links by constructing a co-authorship network as an equation graph with authors who have coauthored papers in the past as nodes. However, equation graphs cannot include the inter-relationships of references in papers, information on which papers are coauthored, and single authorship in the graph.
In this study, we construct a co-authorship network as a heterogeneous graph, with three types of nodes: authors, papers, and the fields of the papers, and create links between authors and papers, if the authors wrote the papers in the past, and between papers and fields, if the papers fall into a certain field.
In general, link prediction predicts whether there is a link between author nodes. However, in this study, we assume that authors who have a high possibility of having a link to the same paper are coauthors.
2. Related Works
2.1 Application of relational graph convolutional networks to link prediction
Kipf et al. [2] performed node classification and link prediction for knowledge graphs using Relational Graph Convolutional Networks(RGCN).
R-GCN is defined as expressed in Equation (1).
The link prediction adopts a graph autoencoder model, as illustrated in Figure 1.
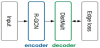
They adopt R-GCN as an encoder, and as a decoder, they employ DistMult, a factorization model for link prediction.
In the link prediction, they experimented with the dataset FB15k-237 and demonstrated that using the R-GCN model as an encoder resulted in a significant improvement over the decoder-only baseline.
2.2 Coauthored network prediction
In related works, the author is represented as a node and the co-authorship as a link in the graph structure. Fujita et al. [3] constructed a co-authorship network for each year of publication, and extracted promising researchers based on the transition of the centrality.
3. Proposed Method
3.1 Overview
We construct co-authorship as heterogeneous graphs, and predict links between author-paper edges that are yet to be observed from the given graph.
3.2 Algorithm
An algorithm for predicting the co-authorship in t+n+1 year based on the co-authorship for n years from t year is presented below.
- Create heterogeneous graphs of author-paper graphs for n years from t year, and paper-field graphs for n + 1 years from t year.
- Perform GCN for each type of edge using R-GCN, and calculate the feature value of each node in the graph created in 1.
- Solve the binary classification problem of whether edges exist between authors and papers from the computed features.
- Authors with higher probabilities for the same paper will be judged as authors who have a co-authorship in the future.
4. Experiments
4.1 Overview
In this experiment, we employed a model that can determine whether a link exists between nodes that have not yet been linked from the graph structure, to predict whether an author is likely to write a paper in the field in the future. Then, we considered authors who are predicted to be linked to the same paper to have a possible co-authorship in the future. We conducted four experiments to predict the co-authorship in t + n + 1 from the co-authorship in n years from t year.
4.2 Dataset
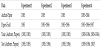
The same dataset was used for each experiment. For the dataset, we adopted S2ORC [4], a dataset of papers published by the Allen Institute for Artificial Intelligence (AI2). S2ORC comprises metadata, which contain the bibliographic information of the paper, and pdf_parses, which contains information on the body of the paper. We extrated the necessary bibliographic from the metadata because we adopted only the bibliographic information of the paper in the experiments. We adopted the bibliographic information of the paper ID, author of the paper, and field of the paper. Using these three pieces of information, we created a graph structure.
Table 1 summarizes the age of the data used in the experiment. We will state the number of data for each in the description of each experiment.
4.3 Experiment 1
4.3.1 Overview
In Experiment 1, we experimented to determine if we can predict links that are not yet used in the graph data, but actually exist (missing links) from the author-paper data and paper-field data in 1985.
4.3.2 Graph construction
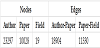
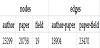
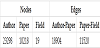
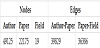
Using the author-paper data and paper-field data for 1985 from the dataset, we represented the co-authorship of papers as a heterogeneous graph. There should be three types of nodes: the paper ID, author of the paper, and field of the paper. In addition, there are two types of edges: a two-way link between the author and the paper if the author wrote the paper, and a directed link from the paper to the field if the paper falls into that field. We used the 1985 data set, with 80 % as train data, 18% as validation data, and 2% as test data.
Table 2 presents the graph data created in the experiment.
4.3.3 Model overview
We adopted the same model in each experiment. The structure of the R-GCN model for predicting links between authors and papers is illustrated in Table 3. From these graph data, we first represent each node as a 64-dimensional vector for each type of node in RelGraphEmbed. Then, the structure of the nodes and edges of the graph and the previous vector representation are used as input data for the three layers of R-GCN.
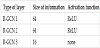
By collapsing the graph for each type of edge, we can obtain the feature value (16 dimensions) for each node based on the information in the graph.
Learning is conducted using the 16-dimensional vector representation of each node obtained by R-GCN. In the training, we adopt 50 author-paper edges as positive samples and 50 randomly selected author-paper pairs as negative samples. Positive samples are labeled “1” and negative samples are labeled “0”. Next, we combine the positive and negative samples to create 100 × 32 dimensions, and linearly combine them to make 100 × 16 dimensions. The ReLU function is then used to obtain a value greater than or equal to zero. It is further linearly combined to make it 100 × 1 dimensional, and then the Sigmoid function is used to obtain values from 0 to 1. We performed training, such that the loss between this value and the label of the train data would be small. Adam optimizer was used as the optimization method, binary cross entropy was adopted as the loss function, and the number of epochs was set to 30.
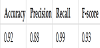
4.3.4 Experiment Result 1
To evaluate the model, we used 50 author-paper edges, the test data, and 50 randomly selected author-paper pairs, and then performed a binary classification to check the existence a link. The correct answer rate, fit rate, reproduction rate, and F-measure were calculated using the correct answer label 1 for edges that actually had links and the incorrect answer label 0 for edges that did not. The following presents an explanation for the accuracy, precision, recall, and F-score, respectively.
- Accuracy
Accuracy is the percentage of correct predictions among all predictions.
- Precision
Precision is the percentage of links that actually exist out of those that are predicted to exist.
- Recall
Recall is the percentage of links that were predicted to exist out of those that actually exist.
- F-score
F-score is the harmonic mean of goodness of fit and repeatability. Equation (2) expressed the formula for obtaining the F-score. F-score is a measure of the balance between the goodness of fit and reproducibility.
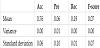
Table 4 presents the averages of accuracy, precision, recall, and F-score for five evaluations. From Table 4, we can deduce that we can predict the presence or absence of a link with high accuracy.
4.4 Experiment 2
4.4.1 Overview
In Experiment 2, using the same model as in Experiment 1, we experiment with how we predict links will be established between authors in 1985 and papers in 1986 that have not yet been linked, based on the author-paper data and the paper-field data for 1985 and the paper-field data for 1986.
4.4.2 Graph construction
We adopt the author-paper data and the paper-field data in 1985 from the dataset and the paper-field data in 1986 to represent the co-authorship of papers as a heterogeneous graph. There should be three types of nodes: the paper ID, author of the paper, and field of the paper. There are two types of edges: bidirectional links if there is a writing relationship between the author and the paper, and directed links from the paper to the field, if the paper is in that field.
Table 5 presents the number of graph data used in Experiment 2.
4.4.3 Experiment result 2
For all authors in 1985,we predict the link to the 1986 paper. Because the results of link prediction are expected to differ for each field of paper to some extent, we conducted experiments for each field. One paper is randomly selected from one field, and the predicted value of the presence or absence of links with all authors is output as a value between 0 and 1 for that paper. The average value was calculated, and those above the average value were given a “1” for predicting that the link would be established, and those below the average value were given a “0” for predicting that the link would not be established. If the field was the same as that of the paper the author had written in the past, it was assumed that there was a high probability that the author would write a paper in the future. If the field was the same as that of the paper the author had written in 1985, the author was assigned the correct answer label 1, otherwise the author was assigned the incorrect answer label 0.
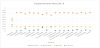
Table 6 presents the average of accuracy, precision, recall, and F-score, respectively, calculated three times for each field.
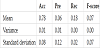
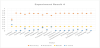
Figure 2 presents a graphical representation of Table 6. From Figure 2, we can deduce that there is a considerable difference in accuracy, precision, and F-score in each field. In contrast, the recall does not vary significantly by field. Precision is similar to the F-score in each field, and the graph is symmetrical to the graph of accuracy.
4.5 Experiment 3
4.5.1 Overview
In Experiment 3, using the same model as in Experiment 1, we conducted an experiment to predict the coauthorship using the author-paper data and paper-field data in 1985 and the paper-field data in 1986 as graph data.
The difference from Experiment 2 is that we unified the values of the 1986 paper-field data. From Experiment 2, we can assume that the results of the link prediction differ for each field of papers; hence, in Experiment 3, we unified the number of graphs for the 1986 paper-field data.
4.5.2 Graph construction
In Experiment 3, we prepared 10 papers from 1986 in each of the 19 fields. First, 10 papers per field were prepared, and each paper in 1986 was checked for links to all authors in 1985. This was done for all 19 fields.
Table 7 presents the number of data for each of the graphs constructed in Experiment 3.
4.5.3 Experiment result 3
The same authors’ links were predicted for papers in the same field. In other words, the same author was selected for every 10 papers in field 1. Therefore, we looked at what the predicted authors would mostly likely write for each field. As in Experiment 2, the predicted values of the presence or absence of links with all authors for a paper are output in the range of 0 to 1. The average value was calculated, and if the output value was greater than or equal to the average value, “1” was assigned for predicting that the link would be made, and if it was less than the average value, “0” was assigned for predicting that the link would not be made. As in Experiment 2, because it can be assumed that links will be made to the same fields as those in which the authors have written papers in the past, we assigned a correct answer label of “1” if the author wrote a paper in the same field in 1985, and an incorrect answer label of “0” otherwise, and then evaluated the results against the predictions.
Table 8 presents the average of accuracy, precision, recall, and F-score, respectively, calculated done three times for each field. Figure 3 presents a graphical representation of Table 8. From Table 8, we can observe that accuracy has decreased compared to Table 6 in the previous experiment result 2; however, variability is slightly smaller. From Figure 3, compared to Figure 2 of the previous experiment result 2, we can observe the same variation of accuracy in each field except for the reproduction rate.
4.6 Experiment 4
4.6.1 Overview
In Experiment 4, using the same model as in Experiment 1, we tested how to predict the linkage between an author and a paper in 1987, which had not yet been linked, based on the author-paper data for two years (1985 and 1986) and the paper-field data for three years (1985 to 1987).
4.6.2 Graph construction
Using the author-paper data for two years from 1985 and the paperfield data for three years, we represent the coauthorship of papers as a heterogeneous graph. Authors who wrote papers in both 1985 and 1986 edged from the 1985 author’s node to the 1986 paper’s node.
Table 9 presents the number of graph data used in Experiment 4.
4.6.3 Experiment Result 4
As in Experiment 2, we conducted an experiment for each field. The model randomly selects a paper from one field and outputs a value in the range of 0 to 1 for the presence or absence of a link to all authors for that paper. A value of “1” was assigned for predicting that the link would be established if the value was above the mean, and a value of “0” was assigned for predicting that the link would not be established if the value was below the mean.
Similar to Experiment 2, we assigned correct labels 1 to the fields in which the authors had written papers and incorrect labels 0 to the other fields, and then evaluated the results against the predicted values.
Table 10 presents the average of accuracy, precision, recall, and F-score calculated three times for each field, respectively.
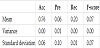
Figure 4 presents a graphical representation of Table 10. From Table 10, we can observe that the overall accuracy is a slightly lower than in Table 6 of experiment result 2; however, the variation in accuracy is smaller. Comparing Figure 4 with Figure 2 from Experiment 2, we can observe that the variation in accuracy is the same.
5. Evaluation and Discussion
5.1 Experiment results
In this study, we conducted an experiment based on the assumption that the probability of a link being made is higher in the field of papers that the author has written than in the field of papers that the author has not written.
5.1.1 Experiment 1
In Experiment 1, with high accuracy, we predicted the presence or absence of author-paper edges (missing links) that were not used in the graph data for that year from the co-authorship graphs for one year.
5.1.2 Experiment 2
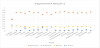
In Experiment 2, we used the model of Experiment 1 to predict the presence or absence of an author-paper edge in the next year based on the author-paper graph for one year and the paper-field graph for two years to extract authors the author likely to coauthor in the next year. The experiment results indicate that a difference in accuracy exists among the fields. This may be owing to the fact that the number of papers in each field is different.
Table 11 presents the number of papers per field from 1985 to 1987.
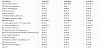
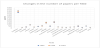
Figure 5 presents a graphical representation of Table 11. From Tables 11 and 6 of the experiment result 2, we can observe that the graphs of precision and F-score, and the graph of accuracy are symmetrical, and the field with a large number of papers exhibits a low accuracy, but a high precision and F-score. This implies that the authors who are predicted to co-author the paper have actually written in the field of the paper before. This is because the more papers there are in a field, the more edges there are in that field, and as a result, the more accurately the features of the authors in that field can be extracted.
In contrast, in the field with a small number of papers, although accuracy is high, precision and F-score are low. This may be owing to the fact that the number of papers was small, i.e., the number of authors who wrote the papers themselves was small; hence, the accuracy was high because predicting 0 would have been the correct answer, and the features of the authors of those papers could not be extracted sufficiently bacause of the small number of edges.
Inaddition, the reproduction rate did not vary significantly by field. In other words, the percentage of authors who predicted that they would be linked among authors who had actually authored a paper in their field of did not vary by field. This is because this model does not predict links for each field, but rather determines whether links exist or not.
The graph demonstrates that the fit ratio and F value are similar. This is considered to be because the F-score varies with the value of the precision, as the recall does not vary in each field.
5.1.3 Experiment 3
In Experiment 3, we unified the number of paper-field graphs in 1986 used in Experiment 2 for all fields and tested how to predict the co-authorship. From Figures 5 and 3 of Experiment 3, we can observe that, as in Experiment 2, although the accuracy is low in the field with a large number of papers, the precision and F-score are high. In addition, compared to Table 8 of experiment result 3 and Table 6 of experiment result 2, the variance and standard deviation became smaller; hence, the variance in the accuracy of the accuracy, precision, and recall reduced; however, there was no improvement in the overall accuracy. This suggests that the difference in accuracy between fields is not owing to the difference in the number of papers used for prediction, but because of the variation in the number of papers per field in the graph data used for R-GCN.
5.1.4 Experiment 4
In Experiment 4, we predicted the co-authorship for the next year based on the co-authorship network of the past two years. From Figures 5 and 4 of Experiment 4, we can deduce that there is a difference in the accuracy depending on the number of papers,similar to Experiments 2 and 3. In addition, the decrease in the average accuracy when comparing Table 10 in Experiment 4 with Table 6 in Experiment 2 can be attributed to the fact that the graph data for two years was constructed as a single graph.
5.2 Future work
In this study, as an evaluation of prediction accuracy, we assigned correct and incorrect labels based on the assumption that a person who has written a paper once is likely to write another paper in the same field; however, this was insufficient as an evaluation because the co-authorship is not necessarily determined by the field.
As a solution to the above, we will consider a method to compare trends in each field by displaying authors with potential co-authorship obtained from papers in each field in a ranking format, rather than simply evaluating them by correct/incorrect answers.
Furthermore, in this study, the threshold is set as the average value; however, because the experiments exhibit differences among fields, a more valid evaluation can be obtained by setting the threshold for each field.
Although the evaluation solely focused on papers that had only one field, in reality, there are papers that cross multiple fields. If these are included in the evaluation, it will be necessary to consider the affinity between the fields. The number of papers published in the next year was used for the evaluation; however, the co-authorship predicted by this model does not necessarily mean the possibility of co-authorship in the next year. Hence, the evaluation method needs to be further examined.
6. Conclusion
In this study, we constructed the co-authorship network as a heterogeneous graph and performed convolution for each type of edge using R-GCN. Then, we extracted authors who may co-author papers in the future by predicting the links between authors and papers.
Our model successfully predicted missing author-paper links with high accuracy from a year’s worth of coauthorship networks. In addtion, we deduced that the accuracy of the evaluation method in this experiment varies depending on the number of edges stretched to the nodes of the graph passed through the R-GCN. As a future prospect, if we can predict the number of papers for the next year, we can improve the flexibility in predicting the co-authorship for the next year when the number of publications is not yet known. Furthermore, accuracy can be improved by considering time series elements in the graphs and by adding new elements in addition to the field of the paper. Further development on the prediction of the co-authorship can be expected using this study.
Competing Interests
The authors declare that they have no competing interests.