


1. Introduction
Some of the new challenges and opportunities in the context of Big Data analytics are as follows. This section discusses the importance of Big Data analytics, and associated paradigm shifts. Essential analytics methodology uses the geometry and topology of data and information.
In a personal communication in 2011, Jean-Paul Benzécri who developed and grew so much of data science, had this viewpoint: "This is my motto: Analysis is nothing, data are everything. Today, on the web, we can have baskets full of data ... baskets or bins?".
The comprehensive survey of [1], with 118 citations, sets out new contemporary issues of sampling and population distribution estimation. An interesting conclusion is the following. "There is the potential for big data to evaluate or calibrate survey findings ... to help to validate cohort studies". Examples are discussed of "how data ... tracks well with the official", far larger, repository or holdings. It is well pointed out how one case study discussed "shows the value of using `big data' to conduct research on surveys (as distinct from survey research)". Limitations though are clear: "Although randomization in some form is very beneficial, it is by no means a panacea. Trial participants are commonly very different from the external pool, in part because of self-selection, ...". This is due to, "One type of selection bias is self-selection (which is our focus)".
Important points towards addressing these contemporary issues include the following. "When informing policy, inference to identified reference populations is key". This is part of the bridge which is needed, between data analytics technology and deployment of outcomes. "In all situations, modelling is needed to accommodate non-response, dropouts and other forms of missing data." While "Representativity should be avoided", here is an essential way to address in a fundamental way, what we need to address: "Assessment of external validity, i.e. generalization to the population from which the study subjects originated or to other populations, will in principle proceed via formulation of abstract laws of nature similar to physical laws".
The bridge between the data that is analyzed, and the calibrating Big Data, is well addressed by the geometry and topology of data. Those form the link between sampled data and the greater cosmos.
The concept of field, of eminent social scientist, Pierre Bourdieu, is a prime exemplar. Consider, as noted in [2], how Bourdieu's work, involves "putting his thinking in mathematical terms", and that it led him to a conscious and systematic move toward a geometric framemodel". This is a multidimensional, "structural vision".
Bourdieu's analytics "amounted to the global [hence Big Data] effects of a complex structure of interrelationships, which is not reducible to the combination of the multiple [... effects] of independent variables". The concept of field, here, uses Geometric Data Analysis that is core to the integrated data and methodology approach used in the Correspondence Analysis platform.
An approach to drawing benefit from Big Data is precisely as described in [1]. Their noting of the need for the "formulation of abstract laws" that bridge sampled data and calibrating Big Data is addressed, for the data analyst and for the application specialist, as geometric and topological.
From a presentation by Frédéric Lebaron [3], with a section on "Investigating fields" there is the geometric modelling of data as instrument of synthesis and representation of the fields. There is the "geometric data modelling" as a way to combine statistical analysis and the notion of field, here quoting from Bourdieu, 2001: "Those who know the principles of MCA [Multiple Correspondence Analysis] will grasp the affinities between this method of mathematical analysis and the thinking in terms of field".
2. Use of Jürgen Habermas's Convergent Processes for Quantifying Collective Impact
The major work of eminent social and political science theorist, Jürgen Habermas, is entitled Theory of Communicative Action (Theorie des kommunikativen Handelns). An aspect of this, relating to thematic convergence in discourse provides motivation for what follows in this section.
There will be the testing of social media with the aim of designing interventions. Application here is to environmental communication initiatives. Measuring impact of public engagement theory is in the Jürgen Habermas sense - public engagement centred on communicative theory; by implication therefore, discourse is taken as a possible route to social learning and environmental citizenship.
We use qualitative data analysis of Twitter; using nearly 1000 tweets between the start of October 2012 and the end of November 2012. Evaluation is carried out of tweet interventions, following eight separate twitter campaigns carried out.
The aim of this particular work is as follows, to analyse the semantics of the discourse in a data-driven way. We may note, [4], how "top-down communication campaigns both predominate and are advised by those involved in social marketing ... . However, this rarely manifests itself through measurable behaviour change". Thus our approach is, in its point of departure and vantage point, bottom-up.
Mediated by the latent semantic mapping of the discourse, we develop semantic distance measures between deliberative actions and the aggregate social effect. We let the data speak (an informal expression due to both the eminent intellectual innovators, Jean-Paul Benzécri and John Tukey) in regard to influence, impact and reach.
Impact is defined as follows: semantic distance between the initiating action, and the net aggregate outcome. This can be statistically tested. It can be visualized. It can be further visualized and evaluated.
The eight Twitter campaigns in October and November 2012, in successive weeks, were as follows: 1, Climate change: The big picture and the global consequences; 2, Climate change: The local consequences; 3, Light and electricity; 4, Heating systems; 5, Sustainable Food choices; 6, Sustainable Travel choices; 7, Sustainable Water use; and 8, Sustainable Waste.
In [4] this data is analysed. Similar to that analysis, here also the number of tweets is 985, punctuation is removed in the tweets and upper case set to lower case. Using the tm package in R, stopwords are deleted. This leads to a corpus of 3237 words. One of the initiating tweets was, in fact, two tweets, so these were merged. Requiring a minimum threshold of word use, and of tweets with the word, setting these two minimum thresholds to 5 leads to a corpus of 431 words. The 8 initiating tweets are explicitly labelled, and what had become empty tweets, 3 of these, are deleted. The data is set up as follows: the set of non-initiating tweets, and the set of 8 initiating tweets, and the retained corpus of 431 terms, with also for every tweet a presence/ absence, i.e. 1 or 0 value, for the set of 8 campaigns. The data to be analysed here, is 981 tweet rows, and 439 columns comprising the corpus and the 8 categorical variables for the category.
The active variables are the non-initiating tweets and the corpus. The clouds of tweets and of corpus words are both endowed with the chi squared distance. This is mapped into the factor space that is endowed with the Euclidean distance. The supplementary variables, projected into the factor space, provide contextual information.
Here, rather than looking at the data's semantic underpinning, essentially provided by the factors, our objective starts with: having the factor space that is the Euclidean-metric endowed semantic space, that maps both clouds of data, the rows, tweets, and the columns, corpus words. Next is our objective to have as denition of impact of an initiating action, the initiating tweet. Our denition here is the semantic aggregate of all tweets, but not the initiating tweet, in the "campaign" period. For each of the "campaigns", this is the mean of the relevant tweets in the factor space. This allows us to map the initiating tweet and its impact, i.e. the semantic aggregate of all tweets that follow the initiating tweet. Figure 1 displays this for the principal factor plane.
We may now consider the following. The statistical significance of impact is assessed through the Correspondence Analysis of the tweets, with the tweets initiating the campaigns (labelled tic in Figure 1) and the overall outcome of the campaign, being the aggregated set of tweets but without the initiating tweet in the campaign period (labelled C in Figure 1). In this figure, in each case, the tweet initiating the campaign is linked with an arrow to the net aggregate of the campaign. The percentage inertia explained by the factors, "Dim 1" being factor 1, and "Dim 2" being factor 2, is noted here. This was also studied in the full, factor space, dimensionality.
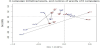
While Figure 1 shows some initiating tweets to be very far from the outcome, i.e. the impact defined by the semantic factor space mean; and some to be very close. We could state that closeness of initiating tweet and its outcome is a manifestation of impact, since the initiating action and its outcome are semantically close. While the visualization provided by Figure 1 is revealing, however the full factor space, with all factors (axes, dimensions) takes all the information content into account. For the full dimensional factor space, here we used 386 factors, i.e. dimensions, these accounting for 99% of the inertia of the dual space of tweet and word clouds.
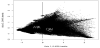
The following is the framework for carrying out a significance test of impact, to be expressed as the statistical significance of proximity between initiating tweet and its outcome. Figure 2 displays histograms of inter-tweet and inter-word distances from the Euclidean metric endowed factor space, with 386 dimensions. Some exceptional tweets are responsible for the extreme histogram values. However, for generality and lack of exceptionality in distributional properties, we simply derive from Figure 2 that a normal distribution is to apply to all distances. For the entire set of tweets, including initiating tweets, words, category of "campaign", the interpoint distances have mean 12.79 and standard deviation 3.58.
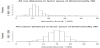
Next looking at the impact, quantified in full dimensionality (here dimensionality comprising 99% of the inertia), as the distances between initiating action and outcome, for the eight "campaigns", these are the distances (here written just with two decimal precision): 7.54, 9.93, 9.41, 5.95, 6.97, 5.52, 3.55 and 8.51. From the assumption of normal distribution, we find that "campaign" 7 here (impact valued as 3.55), is less than the mean minus 2.5 times the standard deviation. This gives the significance of the proximity as 0.5%, and from all that it at issue here, we derive this conclusion: "campaign 7" has very great proximity between initiating tweet and the outcome of the consequent tweet set and this is very exceptional, with probability 0.005.
The achievement of this impact assessment is that it is data-driven (i.e., data-based), and through the semantic factor space, it relates an action/event with either another action/event or, as here, with integrated and collective sets of actions/events.
3. Analytical focus and contextualization. Example: mental health analytics
Context analysis is very crucial in many domains such as social science or in survey analysis where the contextual, i.e. supplemental variables, may be, for example, gender, age, education level, and so on. In [7], discussed is how Big Data sources may provide the context for the data that is analysed, and provide help for decision-making.
While analytical focus and contextualization, in the following preliminary study of mental health, is at issue, implicitly this anaytical question is raised: what will best constitute the focus of the analysis, i.e. the main and active set of variables, and what will most informatively constitute the contextual, explanatory context for this. The first and second analyses were not as informative from the data here.
From [5], obtained were 1704 variables, including questioning of the subjects about symptoms and disorders, psychoses and depression characteristics, antisocial behaviours, eating characteristics and alcohol consumption, drug use, and socio-demographics, including gender, age, educational level, marital status, employment status, and region lived in.
The main variable set is active in the analysis, and thus is the basis or foundation for the analysis. The supplementary variable set is then mapped into the factor space. These constitute contextual information. The analysis is focused on the active variables and individuals, and then supplementary variables, or their modalities, and individuals, are mapped into the semantic, factor space, endowed with the Euclidean distance. The supplementary variables are contextual.
The first analysis was relating to neurotic symptoms and common mental disorders. The data characteristics: 7403 individual respondents; 23 questions with 107 response modalities; of these questions, 1 to 14 are active, and 15 to 23 are supplementary. The 14 active questions have 52 response modalities, and the 9 supplementary questions have 55 response modalities. The 14 active questions were relating to "Neurotic symptoms and common mental disorders", and the 9 supplementary questions were socio-demographic variables. However the socio-demographic variables (the supplementary variables), these were found [7] to be projected close to the origin, therefore showing very little differentiation or explanatory relevance for the symptoms and disorders data.
Second analysis: to characterize the socio-demographic data, and then to see if the neurotic symptoms and common mental disorders data could be explanatory and contextualized. Here also, this was found for these supplementary variables, [7]: no differentiation was found for these supplementary variables, indicating no particular explanatory capability in this particular instance.
Third analysis: It was checked whether neurotic symptoms and common mental disorders data should be jointly analysed with the socio-demographic data. Figure 3 is an illustrative figure, displaying the principal factor plane output. This figure displays the highest contributing variables (contributing to inertia of the axes). The highest contributing elements are the more important for interpretation.
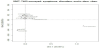
On the positive first factor, what is particularly important, from the contribution to the inertia, is PTSDcom, this label being for "TSQ (Trauma Screening Questionnaire) total score". The negative second factor, is highly influenced by these two variables: "gor06", "newsha", respectively modalities of: "Government office region" and "Strategic Health Authorities". These were both sets of geographic regions in England. (One other such region in each of these variables was London.)
The highest contribution to inertia by indviduals (rows here), or variables (columns), of the projected values of supplementary elements, these may, and hopefully will, support the characterization of the factors. A summary interpretation derived from what is displayed in Figure 3 is how factor 1 accounts for recorded trauma, and factor 2 accounts for region of the respondent. The analysis described here has used all variables as active variables. This was resulting from the interpretable finding that better outcomes were obtained, relative to the first two analyses. The latter were the analysis of health questions, in the context of socio-demographics, and the analysis of sociodemographics, in the context of health issues. Many elements were mapped close to the origin, for the principal factor plane, thereby being interpreted as not being relatively unique and exceptional.
The key theme of this section is how the analytical process, using the data that is sourced, can and must point towards the most informative and interpretative outcomes.
See [6], good for this methodology here, and somewhat further details of this analysis in [7]. Future work relating to Bourdieu's field and homology analytics: with some orientation towards mental capital are in [8], [9]. It is noted in [8] how relevant and important mental health is, given the integral association with physical health. There is the following: "... parity between mental and physical health conditions remains a distant ideal". "The global economy loses about $1 trillion every year in productivity due to depression and anxiety". "Next steps include ... integration of mental health into other health and development sectors". In [9], under the heading of "Five Ways to Wellbeing", reference is made to "mental capital and wellbeing". A section is entitled "The 'mental capital' values of the outdoors". At issue here: going for a walk, therefore taking exercise, in the countryside or parkland.
4. Semantic mapping. Large scale Twitter analytics
At issue in this case study is semantic mapping of Twitter data, relating to festivals - music, film, art, parades. The analysis is directed towards behavioural or activity patterns or trends. Consider the tweeter, variable: from_user. As an important characteristic of the tweeter, consider the associated language, variable: iso_language_ code. This language indicated is indicative only. We consider the days 2015-05-11 to 2016-08-02, with two days removed, 2015-08-29, 2015- 08-30, due to lack of tweets.
For a given language label - which serves as a preliminary selection that is potentially relevant for one or more specific festivals - we carry out the following. Determine the set of tweeters (variable from_user), crossed by the day (variable created_at). In this matrix there is the number of tweets by each tweeter on each day. We consider days that have non-zero tweet activity.
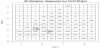
Portuguese, ISO label PT: for iso_lang_code as PT, Portuguese, there were: 449 days, 744584 tweeters, maximum of 21 tweets by a tweeter per day, and total number of tweets: 3166418. This very sparse matrix, of tweeters × days, has 0.63% non-zero values. The first eigenvalues explained the following % inertia: 0.49, 0.46, 0.42, 0.39, 0.38, 0.37, 0.36, 0.34, 0.33 ... Top contributions to factors are in Table 1. This table lists the most contributing, thus the most important, tweeters (users) and dates (the day), associated with the first few - five - factors. The three most contributing tweeters or days are considered here.
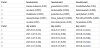
See Figure 4. Figure 5 presents a grid-based display of the tweet cloud mapping in the principal factor plane. Benefits: (i) efficient storage of the plot; (ii) potential for using this grid display for other additional mapping here; (iii) potential interest in the pre-determined clusters associated with grid cells, i.e. local densities.
Current considerations are as follows, following the general work accomplished in [10]. First, determine some other, related or otherwise, behavioural patterns that are accessible in the latent semantic, factor space. Second, retain selected terms from the tweets, and, as supplementary elements, see how they provide more information on patterns and trends. Third, carry out year by year trend analysis.
5. Conclusion
This paper has addressed in a practical manner, knowledge discovery through data mining, hence unsupervised machine learning. Themes that were at issue, in an application-oriented manner, were resolution and scale, bias and its avoidance, and analytical and procedural focus or orientation or direction. An outcome is the use of data mining for prescription objectives. This is to express action and decision support. It can be noted that in various ways, such prescriptive objectives may be complementary to machine learning based prediction. In all that is at issue here, the context is very important. In the Introduction section, it was also noted how important the context is, and the resolution scale of both what is analyzed, and the resultant analytical processing. Associated with the latter is the analytical focus, or orientation and direction.
Competing Interests
The author declare that there is no competing interests regarding the publication of this article.