


1. Introduction
We are in the era of big data that it is changing the face of computation and networking. Meaningful information is extracted from historical as well as run time data become valuable. Traditional data systems, such as relational databases and data ware houses, have been used by the businesses and organizations form the last 40 years. Traditional systems are used with primarily structured data with the following characteristics:
- Fields are clearly organized in records and records are stored in tables. Each table has a name as well as fields with some relations among the fields.
- A design to retrieve data from a disk and load it into memory. With large volume of data, it is inefficient to load such data in memory and inefficient to handle it with small programs. In fact, relational and warehouse databases usually is capable of reading 8k or 16k block sizes only.
- For managing and accessing the data, Structured Query Language (SQL) is used with the structured data.
- The traditional storage solutions are too expensive.
- Relational databases and data warehouses are not designed for the new types of data in terms of scale, storage and processing.
However, still some people ignore the concept of big data doubting that they can benefit from it. Nevertheless, some facts that may lead to the revolution of the big data concepts cannot be ignored. Some of these facts are:
- The generated data in the past two years are more than the data created in the entire history.
- Due to the fast increase in the generated data, it is expected by the year of 2020 to reach 1.7 megabytes of new data to be generated every second for every human being on the planet.
- The universe digital data will be grown from 4.4 zettabyets to around 44 Zettabytes, or 44 trillion gigabytes.
- The number of likes per minutes for brands and organizations on Facebook reached 34,722 likes.
- 100 terabytes of data uploaded daily to Facebook only. P o o r data across businesses and the government costs the U.S. economy $3.1 trillion dollars a year.
Big data term is defined as a collection of various unstructured, structured, and randomized data generated by multiple sources with different formats with huge volume that cannot be handled with current traditional data handling techniques. Big data is characterized by five parameters, shown in Figure 1 as follow [10]:
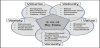
1.1 Volume
The major challenge of big data is the storage, formatting, and analysis of huge volume of data. Big data is not concerned of Giga Bytes anymore, it is now challenge of petabytes and zettabyets. In fact, by the year of 2020, it is expected that the data volume will grow by 50 times.
1.2 Variety
The variety means that data is unstructured or semi-structured data. For instance, the data could be in the form of documents, graphs, images, emails, audio, text, video, logs, and many other formats.
1.3 Velocity
The term velocity usually refers to the data streaming where data could be collected from sensors, video streaming, and websites. The problem with the data stream is data consistency and completeness as well as time and latency. Analyzing such data is still a challenge.
1.4 Value
Data value means how beneficial the data to be analyzed. In other words, is it worth to dig in the data? Such question is another challenge because it is costly in terms of money and time to analyze the data.
1.5 Veracity
Veracity is the data quality which refers to the data noise and accuracy. This is another factor that may affect the data analysis approach as well as the required time and data dependency in taking decisions.
Along with these parameters, there are some other issues such as performance [33], networking [46], pre-processing techniques [16], and analysis techniques [44]. This paper surveys some of the important and most used tools for big data. The main purpose of the paper is to categories the big data tools to the benefit of researchers and the big data community.
The paper is organized as follows: the following section discusses some of the big data challenges, section 3 explores data storage and management tools, section 4 explains the main features of some of the big data platforms, Big data analysis tools is discussed in section 5, section6explicatessome of the big data visualization tools, finally the paper ends with a discussion and conclusion.
2. Big data challenges
Big data has many challenges that can be classified according to Sivarajah et al. [49] to data challenges, process challenges, and management challenges. Data challenges involves the big data characteristics (volume, verity, velocity, value, and veracity) in addition to visualization and variability. In terms of data processing the challenges are in data acquisition and warehousing, data mining and cleaning, data aggregation and integration, analysis and modeling, and data interpretation. In terms of data management, security, privacy, data governances, data sharing, cost expeditious, and data ownership.
Loshin in [50] specified five more challenges as follow:
2.1 Uncertainty of the Data Management Landscape
There are many tools that are competing in working on the big data analysis and each one of them is related to specific technical area. So, the challenge is to choose the suitable tool among the large number of tools that does not introduce any unknown or risks the data.
2.2 The Big Data Talent Gap
Big data is a new hot topic and it seems that there are only few experts in the field. Although many people claim that they are experts, due to the novelty of the big data approaches and applications, there are a gap in the experts. In fact, finding a person with practical experience in handling big data is a challenge.
2.3 Getting Data into the Big Data Platform
With the huge data in terms of scale and variety along with unprepared data practitioner makes it hard to get the data into the big data platform. In addition to the challenge of accessibility and integration in such case.
2.4 Synchronization across Data Sources
With huge data feeded into the big data platforms, you may realize that this data is coming from variety of sources at different times with different rates. This may lead data to be out of synchronization with their sources. Without ensuring data synchronization, the data will be exposed to risk of analysis and inconsistency.
2.5 Getting Useful Information out of the Big Data Platform
Big data usually used by different applications for different purposes at different levels. The challenge here is to adequately provide these different applications with what they need to keep them doing what they supposed to do.
In the following sections, we will review some of the important big data tools and platforms classified into:
- Data storage and management tools
- Big Data analytics platforms
- Big Data analysis tools
- Big data visualization tools
3. Data storage and management tools
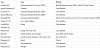
The problem with any application starts at the point of storing its huge collected data. Therefore, there are some solutions came to the light to solve the big data storage problem. The following are some of the most famous tools that are already used in some of the applications and Table 1 summarizes the characteristics of the data storage and management tools.
3.1 Cloudera [48]
Cloudera is an extension version of Hadoop with extra services. Cloudera has Enterprise Data Hub, analytical database, operational database, and data science and engineering products for treating different data. Enterprise Data Hub is an enterprise data hub that it is built on Hadoop framework and Apache Spark as the data repository. The hub is designed to deal with the big data issues in terms of volume, variety and velocity. It also supports some security techniques for sensitive data.
3.2 Apache Cassandra [4]
Cassandra is another distributed database management system over large structured database across multiple servers. Cassandra architecture is not like traditional architectures that uses master-slave or difficult-to-maintain shared architecture but it based on a masterless ring design where all of the nodes play the same role. Again, it is based on NoSQL quires where data is stored in no tabular or relational format. It is built on Dynamo-style replication model avoiding single point of failure; however, it adds a more powerful column family data model. Many of the companies like Apple, Comcast, eBay, Instagram, Spotify, Uber, and Netflix use Cassandra for their database core.
3.3 Chukwa [5,37]
Chukwa is another product that it is built on top of Hadoop. It is an open source distributed file system that inherits Hadoop Distributed File System (HDFS) and Map/Reduce framework features in terms of scalability and robustness. The core of Chukwa is a pipeline that take the data from it is generated to a place to be stored. It also involves toolkits for displaying, monitoring and analyzing data.
3.4 Apache HBase [2]
Apache HBase is an open-source platform that it is distributedfor non-relational database.HBase is designed after Google's Bigtable and Apache Phoenix project [https://phoenix.apache.org/] is used as its SQL layer. It also supports high table-update ratesand it maintains data consistency in reads and writes transactions. In addition, HBase features compression and inmemory operation.
3.5 MongoDB [30]
MongoDB is an open source documents database that is based on Value-Key pairs. The database uses NoSQL for query. It supports dynamic schema, full index, replication, high availability, and data interchange format called BSON. It also allows data to be distributed among different systems. The idea comes from the data explosion at Double Click web advertising company. MongoDBworks on Windows, Linux, OS X, and Solaris.
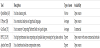
3.6 Neo4j [11,17,31]
It is open source community edition graph database. The main idea behind Neo4j is that it is built based on the concept of an edge, a node, or an attribute. Each node may have different attributes. Nodes and edges could have labels where they are used for search. Neo4j works on windows and Linux.
3.7 CouchDB [6]
CouchDB is another distributed database designed for big data. It is mainly designed for web that stores the data in JSON documents. CouchDB handles varying traffic including sudden spike in traffic. It is very scalable in terms of shrinking depending on the data needs. CouchDB works on Windows, Linux, OS X, and Android.
3.8 OrientDB [37]
OrientDB is a multi-model distributed NoSQL engine that works with different types of data including GeoSpatial, Document, Graph, Key-Value, and Reactive models. It is also scalable where it is based on layering architecture. It also involves security profiling based on users, roles, and search queries. OrientDB is written in java and works on O.S. independent.
3.9 Terrastore [42]
Terrastore as described at [42] is free tool based on Terracotta where it is build clustering methodology. It is also distributed, ubiquitous, elastic, scalable, consistent, and schemaless. It support different event processing, data partitioning, and range queries and it is OS Independent.
3.10 HibariDB [9]
Hibari is described as distributed, ordered key-value store. It is based on the concept of predictable latency especially in read and write ensuring data consistency and durability. Hibari is able to store PetaBytes of data distributing it across servers. In addition, it is based on ordered key-values. Moreover, it uses chain replication methodology for replicating the data across multiple servers. It is also O.S. Independent.
3.11 Riak [38]
Riak is a distributed NoSQL database. It is designed to work on for public, private, and hybrid clouds. So, it is recommended for IoT applications. The open source versions of Riak are Riak KV, Riak TS and Riak S2. It is based on NoSQL key-value data store in which it offers different features including: (1) high availability, (2) fault tolerance, (3) operational simplicity, and (4) scalability. Riak works on Linux and OS X.
3.12 Hypertable [14]
It is open source distributed database system that is completely implemented using C++. It is built on the top of Apache HDFS, GlusterFS or the CloudStore Kosmos File System (KFS). It is also based on NoSQL database offering efficient and fast data processing. It mainly works on Linux and OS X.
3.13 Blazegraph [3]
It is graph database that it is described as powerful and flexible representation of different types of data. It could be used in different types of applications including Internet of Things (IoT), Genomics / Biology, cyber security and national defense. It offers Blueprints and RDF/SPARQL APIs and supports for up to 50 Billion edges on a single machine. Blazegraph has a free version to use that it is platform independent.
3.14 Hive [25]
Hive is a data warehouse project that is built on the top of Hadoop for data summarization and analysis. It provides an SQL-like query language called HiveQL. It is developed by Facebook and other companies such as Netflix and Financial Industry Regulatory Authority (FINRA). Again it is O.S. independent.
3.15 Infinispan [22]
Infinispan is not quite big data database tool but it is a distributed in memory key/value data store with optional schema. It is written in java for language and O.S. independent. It also offers Web-based administration console for servers.
4. Big Data Analytics Platforms
Big data analytics platforms are enterprise platforms that are designed to provide functions and features for big data applications. It helps enterprises to discover unknown correlations, market trends, and useful information out of verity of big data. Table 2 summarizes the main characteristics of the most used platforms and the following is the description to them.
4.1 Hadoop [39]
Hadoop is an open source software that for data storage and distributed processing. The main idea behind Hadoop is store the data on distributed machines/clusters instead of keeping it on a single machine. Hadoop project started in 2005 and it is still one of the well-developed projects for big data storage. Hadoop framework is a little complicated where it consists of four modules which are Hadoop Common, Hadoop Distributed File System (HDFS), Hadoop YARN, and Hadoop MapReduce as can be seen in Figure 2.
Hadoop common contains libraries needed by other modules and Hadoop Distributed File System (HDFS) is a distributed file system on distributed machines. Hadoop YARN is responsible for managing the system resources while Hadoop MapReduce is the programing model for the data processing which is in the Java language. One disadvantage of Hadoop is that it is hard to install and deal with.
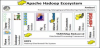
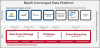
4.2 MaPR [26]
The MapR is one of the open source platforms that integrates different tools such as Hadoop, Spark, and Apache Drill as shown in Figure 3. It handles real-time database, event streaming, and enterprise storage. In addition, it adds a security layer at the top of the data with reliable data processing. MapR has the following features:
- MapR supports all Hadoop APIs and Hadoop data processing tools to access Hadoop data.
- MapR provides true Network File System (NFS) capabilities.
- MapR supports authentication services via Kerberos and/or LDAP.
- Performance-optimized architecture for faster data processing and analytics
- Architecture designed specifically for high availability across all cluster operations
- Automatic disaster recovery through mirroring to synchronize data across clusters.
- Direct Access NFSTM for real-time data access to Hadoop data.
- Distributed metadata to support trillions of files in a single cluster.
- Comprehensive security controls to protect sensitive data.
- Consistent snapshots for accurate point-in-time recovery
- MapR HeatmapTM for instant cluster insights
- MapR volumes for easier policy management around security, placement, retention, and quotas
- Integrated NoSQL and event streaming for advanced real-time capabilities
4.3 IBM Big Data [21]
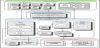
IBM offers many big data tools including IBM big SQL, Analytics for Apache Spark, BigIntegrate, Cloudant, Streams, Compose, and InfoSphere big match. It is designed to put forward enterprise Hadoop solutions, enable users to store big data, process data over multiple servers. At the same time, it makes the data accessible to all parties including IT users, business analysts, and data. Figure 4 is IBM Big Data and Analytics Reference Architecture –Detailed Capabilities.
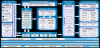
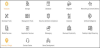
4.4 Amazon Web Service [1]
Amazon provides another set of products for big data analysis including compute, storage, databases, analytics, networking, mobile, developer tools, management tools, IoT, security and enterprise applications, as shown in Figure 5. For instance, presented in Figure 6, analytics tool involves Amazon Athena which is query service allowing data analysis on Amazon S3 using standard SQL. AWS Elastic Beanstalk is an amazon service for web applications deployment and scaling using variety of programming languages and servers including Apache, Nginx, Passenger, and IIS.
4.5 KNIME Analytics [24]
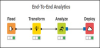
KNIME analytics platform is an open source for data analytics that it is used to predict new futures and discover the potential hidden in the data. Figure 7 shows the end-to-end analytics proposed by KNIME. It contains more than 1000 modules and a range of advanced algorithms. Some of these modules are:
- Connectors for all major file formats and databases
- Support for a wealth of data types: XML, JSON, images, documents, and many more
- Native and in-database data blending & transformation
- Math & statistical functions
- Advanced predictive and machine learning algorithms
- Workflow control
- Tool blending for Python, R, SQL, Java, Weka, and many more
- Interactive data views & reporting
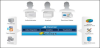
4.6 Microsoft Azure [28]
Microsoft Azure is cloud based big data platform that it is for building, testing, deploying, and managing applications. It provides different services including: (1) software as a service (SAAS), (2) platform as a service and (3) infrastructure as a service. Some of these services are HDInsight, Machine Learning, Stream Analytics, Azure Bot Service, Data Lake Analytics, Data Lake Store, and Data Catalog. HDInsight is a cloud Spark and Hadoop service while Machine Learning is a fully-managed cloud service that enables you to easily build, deploy, and share predictive analytics solutions. In addition, Stream Analytics is an on-demand real-time analytics service to power intelligent action while Azure Bot Service is an intelligent, serverless bot service that scales on demand. Data Lake AnalyticsData Lake Store, and Data Catalog are distributed analytics, hyperscale repository, and an enterprise-wide metadata catalog that makes data asset discovery straightforward, respectively. Big data solutions architecture provided by Microsoft Azure is shown in Figure 8.
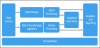
4.7 Datameer[7]
Datameer is another platform that is built on the top of Hadoop as shown in Figure 9. Hadoop distributes the data and the computational load over multiple the network computers while the datameer tools allows easy loading and extracting data from multiple sources regardless the data formats. Datameer benefits from Hadoop in its data scaling and replication where Hadoop scales to 4000 servers and petabytes of data and the processes are fully parallelized inside Hadoop clusters. For data visualization there is built-in infographic widgets in addition to the interactive spreadsheet.
5. Big Data Analysis Tools
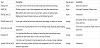
Data mining is all about searching of new patterns or unrecognized patterns. Data analysis is about breaking the big data down and tries to evaluate the impact of the discovered pattern over time. The following is the description to the most used big data analysis toolsand some of the characteristics of these tools are stated in Table 3.
5.1 OpenRefine (formerly Google Refine) [43]
OpenRefine is a data cleaning tool that it is easy to use. Its user interface is similar to Excel in which data can be imported or exported into different formats. It has built on a set of algorithms that it can match data together. It also allows direct connection to websites for uploading the resulted clean data. In addition, it is easy to learn tool but it need some time to review the cleaned data in case of large amount of data.
5.2 R Project [36]
R project is a statistical analysis and graphical language (linear and nonlinear modeling, classical statistical tests, time-series analysis, classification, clustering,). It is effective in terms of data handling and storage. It also has a large collection of analysis tools. Moreover, it is a simple programming language that it is very close to the traditional languages.
5.3 GridGain [15]
GridGain is in memory computing platform built on ApacheIgnite. It could be used as alternative to MapReduce since it is compatible with Hadoop Distributed File System. GridGrain is designed to work on real-time data on Windows, Linux, and OS X. It has three editions which are professional, enterprise, and ultimate editions. The difference between the professional and enterprise editions is that the professional does not support the following features:
- Management & Monitoring GUI
- Enterprise-Grade Security
- Network Segmentation Protection
- Rolling Production Updates
- Data Center Replication
- Cluster Snapshots
On the other hand, the enterprise edition doesn’t support the cluster snapshot feature while the ultimate edition support it.
5.4 HPCC [19,29]
HPCC stands for High Performance Computing Cluster and is also knows as DAS (Data Analytics Supercomputer). HPCC is an open source data analysis tool developed by LexisNexis Risk Solutions providing high performance data computing and parallel data processing for big data analysis. HPCC architecture is given in Figure 10 where it depends on its analysis on patch parallel data processing and indexed data files (Roxie) format for data query. In case of parallel data processing HPCC uses one of two frameworks. The first framework is called a data refinery which is basically data cleaning and creation of keyed data and indexes for high performance computing while the second framework is designed for rapid data delivery engine.
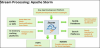
5.6 Apache Storm [18]
Storm is another data analysis tool that it is owned by Twitter and described as Hadoop of realtime. Storm is developed to handle unbounded streams of data. Storm has no limitation in terms of development where any programming language can be used. At the same time, it is reliable where each tuple is processed at least once. Figure 11 shows the Storm streaming processing modules.
6. Big Data Visualization Tools
In this section, we introduce some of the most big data visualization tools including Google Fusion Tables, Tableau Public, Zoho Reports, Weave, Datawrapper, Jolicharts, Microsoft Power BI, Plotly, and Qlik Sense Desktop. The selection of these visualization tools are selected based on their functionalities and simplicity. Table 4 summarizes some of the features of these tools.
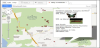
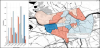
6.1 Google Fusion Tables [13]
Google fusion tables is one of the tools that it converts data into charts or maps as given in Figure 12. It allows users to upload files with different formats and presented in a chart or map forms including map,table, pie chart, bar graph, scatter plot, line chart and other types. It is easy to use and it utilizes geographic information system (GIS) functions to analyze data by geography. However, it is not a final version yet where google consider it as an experimental product.
6.2 Tableau Public [35]
Tableau public is another visualization tool that allows user visualize interactive data in suitable charts. It could be used by websites, students, writers, journalists, bloggers, and professors. It is easy tool to be used, so users can let the tool suggests the best visualization type. It also offers performing calculations on data and it allows almost 15 million row per workbook. However, the free version publish your work online even if it is not completed. In other words, the user has to complete his work in one session.
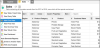
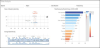
6.3 Zoho Reports [47]
Zoho reports is a web based tool for visualization that makes it easy on users to visualization different types of data file formats including databases. It converts the supported data files into charts or any formats suitable to the ones used by most spread sheets users. It also allow users to to create insightful reports and dashboards. However, the visualization tool still basic and limited especially in the free version where it supports only up to 100,000 row. Figure 13 shows a screenshot from the tool.
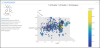
6.4 Weave [45]
Weave is an open source general-purpose visualization tool that allows users to create different visualizations including a bar chart, scatter plot and map. In addition, it handles wide variety of relational and no-relational data sources including SHP/DBF, SQL, CSV, GeoJSON, and CKAN. It is also very interactive tool that shows the runtime changes in the charts as well as it is a cross-platform tool. However, the tool requires experienced user to install it and requires flash enabled browser. Figure 14 shows a sample of Weave output.
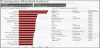
6.5 Datawrapper [8]
Datawrapper is an open source tool that allows users to create simple and embedded charts as given in Figure 15. It is originally developed for journalist but it could be used by others as well. The charts are hosted on Amazon Web Services and users will be able to download the data through a provided link. Datawrapper offers control over colors and data grouping with no previous experience; however, it is missing the flexibility in customization. The free Datawrappersupports up to 10,000 chart views; however, the commercial version is unlimited.
6.7 Jolicharts [23]
Jolicharts is web based service that converts spreadsheets, JSON or databases into maps, graphs, or charts. Multiple charts on a dashboard can be arranged and it allows to add filter boxes multiple visualizations can be handled at once. Jolicharts allows only 50MB data storage for free; however, the commercial version allows data storage up to 250GB. In addition, the documentation needs enhancement.A sample chart generated by Jolicharts is presented in Figure 16.
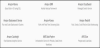
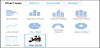
6.8 Microsoft Power BI [27]
Power BI allows user to simply create interactive visualizations, dashboards and reports out of large data.It uses a simple natural language (R language) to query the data on dashboards. It is flexible to use multiple data sources including Salesforce, MailChimp, Google Analytics, and GitHub. Some of these sources are presented in Figure 17. In addition, Power BI has different versions for different platforms such as desktop, Mobile, web, and embedded. The desktop version is free while other versions are commercial.
Plotly is another visualization tool that allows creating and sharing data visualizations. In addition, it includes statistical analysis tools. Moreover, it offers separate API (R, Python, JavaScript and MATLAB APIs) for users to add their own custom graph functions. Again it accepts several data formats including CSV, Excel, and Access, spreadsheets from Google Drive, TSV, and MATLAB. The community version of Plotly involves only unlimited public files, PNG and JPEG data export, 250 API calls per day, and the connection to 7 data sources. However, the commercial version could support Unlimited Private Charts, Dashboards and Slide Decks, SVG, EPS, HTML, PDF, PNG and JPEG data export, 10,000 API Calls per day, and Connect to 18 Data Sources. Figure 18 shows a sample from Plotly charts.
6.9 Qlik Sense Desktop [40]
Qlik Sense Desktop is another visualization service that is offered as cloud based or desktop based. The service allows drag and drop to create interactive data visualization without complex SQL queries, scripting, or joins. It has an APIs for developers to extend and embed Qlik Sense in their applications. Figure 19 shows a sample from Qlik Sense dashboard.
6.10 ChartBlocks [57]
ChartBlocks is an easy tool for generating different types of charts including Bar, Line, Pie, and Scatter. ChartBlocks provides an Application Programming Interface (API) library for creating charts and embedding them into web pages. The library allows creating stream live data charts as well as pulling raw data. ChartBlocks tool comes with four options including basic, personal, professional, and elite. The only free version is the basic which allows up to 30 active charts.
7. Discussion and Conclusion
Throughout this paper, we reviewed the most used big data techniques. These techniques are classified into four classes which are storage and management, platforms, data analysis, and data visualization. As can be seen, these tools are gaining great attention from academia, businesses, and industry. They also cover a wide range of applications and they are very successful in many of these applications. However, our vision to the future could be summarized as follows [53-56]:
- The learning curve of the current tools and platforms are high and it needs experienced users to deal with.
- The available big data platforms are not generic enough to be used in different applications. In addition, the free versions are very limited. At the same time, the commercial versions are expensive and does not fit mid-size organizations as well as researchers.
- The cost of the commercial tools limits Universities and Masters and Ph.D. students’ contributions.
- Although there are some tools are considered as “cross platform”, the actual implementation and usage to these tools reveals that there are not straight forward, a large number of problems appear when using different platforms.
- Although some tools are using some of the Computational Intelligence (CI) techniques in their cores, still there is a lack of implementation to a wide effective range of algorithms and techniques.
- Up to our knowledge, most of the big data languages are new and not tested in real applications.
In our future work, we will investigate deeply into data storage and management tools. In addition, we will report our practical experience using each of these tools
Competing Interests
The author declare that there is no competing interests regarding the publication of this article.