


1. Introduction
In remote and offshore areas, people are struggling to have quick access to healthcare services due to a number of difficulties in cost, communication, management, time and transportation. In recent years telehealth systems have provided a great opportunity for enabling easier access to services for both emergencies and follow up. Furthermore, telehealth technology is evolving rapidly and has enhanced its effectiveness and efficiency through advances in new technologies [1] .
In the telehealth scenario the specialist doctor and patient communicate remotely using computer technology. In addition to medical history and patient data, doctors receive digital images that show different pathologies in the affected areas. Accurate color differentiation in digital images plays a vital role in diagnosis. Doctors may perceive the colors in these images differently due to a number of reasons: such as visual problems in relation to color perception, poor image quality or resolution, or interference from lighting or reflection in the display or viewing area.
This study focused on the use of digital images in “store and forward” teleconsultation (SAF) within telehealth. There are two key critical challenges in SAF teleconsultation that may affect the accuracy of diagnosis when using digital images. Firstly, the quality of the image plays an important role in the diagnosis, which may decrease after the transmission to the medical professionals. Secondly, the differences in color perception, which is a key cognitive process that occurs naturally, could also affect the diagnosis using the digital images.
The current study, which focused on using digital images and color perception in telehealth, was a multi-disciplinary combination that integrated HCI, information system, human factors, engineering and healthcare. CE (sometimes called cognitive system engineering or CSE) is one of the recent terminologies that refers to the design of technology, training, and processes intended to manage cognitive complexity in sociotechnical systems. This definition includes identifying, judging, attending, perceiving, remembering, reasoning, deciding, problem solving, and planning [3] . The use of store and forward teleconsultation for diagnosing cellulitis was introduced, with their use in telehealth systems, more specifically in teleconsultation where they can be used as a common communication language or guide tool in classifying colours when diagnosing pathologies, such as cellulitis and conjunctivitis. This paper opened a door for further studies in this area, in order to confirm the results found. This study also introduced the use of an image quality scale, which shows different standard samples of digital images with different resolution levels, as a guide when selecting and deciding on the suitability of an image received for diagnosis of the pathology that it presents, in this case cellulitis and conjunctivitis.
The evidence indicates that colour perception appears to be generic in its mechanism and the accuracy of the performance of individuals was generally consistent across all the participants in the experiments. This was particularly interesting because it suggested that nondoctors may be able to work in telehealth roles previously filled only by qualified doctors. This could include communication with patients, receiving and rating image quality and categorising redness. This could constitute a considerable saving in resources and costs. The final diagnosis would necessarily remain the job of doctors, due to their level of qualification and the legal and ethical considerations, but in theory, it should be possible for persons qualified to a lower level to be involved in the inspection and classification of submitted images, referring the necessary cases to a medical doctor for diagnosis and treatment.
2. Telehealth Background
The term telehealth (sometimes called telemedicine) refers to the use of telecommunication and information technologies in medicine, in order to provide healthcare services remotely, without the usual face-to-face doctor to patient meeting. Telehealth includes the use of images, multimedia, internet, data and voice to provide healthcare services. Initially it involved consultative services only but now the service has expanded considerably [4] . The core idea of telehealth is to exchange medical data and information in order to provide a more effective and satisfactory healthcare service across geographic, social, cultural and time-based differences. Currently, telehealth is used for diagnosis, treatment, administration of therapies, and prescription as stated by [5] .
Healthcare providers and organisations have become more interested in employing different types of technologies to support, enhance and expand their services by using advanced telecommunications technologies. The availability and low cost of upgraded internet connections and technologies, such as computers and input and output devices, played significant roles in developing and spreading telehealth services. These services made telehealth increasingly available and easily embraced by healthcare providers and patients who currently demand more convenient healthcare services. According to [5] , 80% (or 113 million adults) in the United States use the internet for healthcare information. They stated that patients, especially in remote and rural areas, expect personalised connectivity and communication with healthcare providers along with easy self-service access to their personal health information. This is also supported by [6,7] who stated that enhanced technology motivates people to demand more control over their lives and health by staying home with fewer instructions from healthcare workers. In general, patients prefer more control over their privacy, health management, schedule and activities rather than being institutionalised.
Stated that telehealth is not a new branch of medicine; rather it is a new methodology by which healthcare is provided [8] . It is widely used in advanced countries such as USA, Australia and the UK, and there is increased interest in developing countries. They elaborated that telehealth can be classified based on the level of interaction between the patient and the medical experts as real time and pre-recorded teleconsultations. It can also be classified into the type of medical data transmitted as text, audio, video, images etc. Moreover, from the surveys, the authors have found that the application of telehealth is either in the case of emergency for rural areas or to improve the existing services. In other words, telehealth provides opportunities for individuals to improve their health by easing communication with healthcare providers, from whom they are distant and whom they may not have met personally.
2.1 The colour red and image matching in healthcare and telehealth
Images are made available for medical analysis using capturing equipment which is widely available as fixed, portable and mobile in many forms, as cameras or integrated as a part of an electronic and digital system such as mobile phone with integrated camera function, computers and laptops with camera and several others new digital system with incorporated cameras.
Digital systems find usage in medical imaging research because images are easily stored when converted to digits or bits; digital images can be easily transported from location with the aid of communication networks. Images in digital format are suitable for medical analysis.
2.2 The importance of the colour red in healthcare and telehealth
As stated by [24] , the red colour is very significant in medicine because it is considered by doctors as one of the key symptoms or reference points when diagnosing many medical conditions. From a pathophysiological perspective the colour red or redness (rubor) is one of five cardinal signs of inflammation, along with the other signs including; swelling, heat, pain and loss of function. This classical description of inflammation accounts for the visual transformations that are perceived during several disease states. McNeil et al. (2002) elaborated that colour provides critical information in medical digital images for medical experts, such as dermatologists, when diagnosing pathologies remotely.
It is acknowledged that inflammation is a complex process, which involves a major immune response to infection (however not all infections cause inflammation) and tissue destruction. Inflammation is often divided into two types, acute and chronic, and there are extensive causes of inflammation such as bacterial or viral infections, or trauma. The course of inflammation can also range from acute inflammation, for example as a result of S. aureus infections of the skin, to chronic inflammation which can result in arthrosclerosis such as remodelling of arterial walls. The increased redness that is perceived during some conditions is due to additional erythrocytes (red blood cells) passing through a specified area of the body. Since rubor is a cardinal sign of inflammation it would be justifiable to state that redness is likely to play a significant role in the diagnosis of several clinical diseases such as; psoriasis, candidiasis, phototoxic rash, cellulitis. Most of the pathologies noted are dermatological in nature and involve rubor as a sign. Redness is also a key symptom in other medical conditions such as conjunctivitis or red eye. The importance of rubor varies depending on the condition or illness.
2.3 Using colour scales in medicine
Diagnosis can be subjective (i.e. based on clinical experience, knowledge and perception) or objective (i.e. when there are standardised clinical tests such as laboratory). The benefit of using a diagnostic scale is that it provides doctors with an objective measurement and reference to assess clinical cases. This can be coupled with their clinical experience to reduce the number of errors (mainly misdiagnosis). There are several pathologies that are diagnosed in a more subjective manner such as; lupus vulgaris, toxic erythema, TENS, cellulitis, psoriasis, candidiasis, phototoxic rash and conjunctivitis. For this thesis cellulitis and conjunctivitis were chosen as common examples. The diagnosis of pathologies with redness such as cellulitis and conjunctivitis is predominately subjective. It is subjective because of differences in clinical experience and doctor perception. Thus, there should be a drive to make such diagnosis more objective. The following section provides a brief of key previous studies showing the importance of using colour scales in medicine in order to provide more objective diagnostic outcomes. Previous studies by [27] have suggested that using medical images to standardise diagnostic assessment can improve accuracy of record keeping and also minimise subjectivity when compared to verbal descriptions with an arbitrary scale for severity.
Historically, McMonnies and Chapman-Davies in 1987 were the first to formulate a photographic scale assessing ocular responses to contact lens wear. This scale laid the foundations for future scales and demonstrated that usage of their scale exhibited high levels of inter and intra observer reliability. Many scales often use five steps to represent differing scales of severity and often these reference images are selected based on clinical experience or subjective judgement. It is this subjectivity that is often criticised as it can result in unevenly spaced reference points, which do not represent the full range of possibilities. In the same way, dermatological tests require the application of the practicioner’s subjective assessment, as opposed to objective tests, such as haemoglobin count, to which a measured value can be applied.
Several studies have investigated the effects of incremental steps between the reference images of a grading scale on observer reliability, between other observers for a repeated task and for the same observer during varying conditions. Rheingans (2000) stated five considerations when designing any colour scale. These are goals, nature of data, audience, overall visualization, and cultural connotations. These considerations are very relevant for the current study, for example: the diagnostic goal, colour red intensity, and clinical background of the operators.
Another study by Schulze-Wollgast et al. (2005) stated three main factors that influence the choice of colour scale when presenting data. These factors are: type of data, visualisation goal, and general context which includes user colour perception, output device and user preferences. Based on these criteria they developed a method for choosing appropriate colour scales automatically. They used the colour scale to represent data, which includes any type of data. In contrast the current study used the red colour scale to represent the degrees of intensity in an image. Furthermore they used the scale to visualise data quantitatively while the current study used the red colour scale for interpretation and diagnostic purpose. The mentioned factors also were emphasised by another study by [21] who explored the challenges when designing scales. They focused on designing the semantic differential scale (SDS) which is used for measuring social attitudes especially in linguistics and sociology. SDS has a number of divisions presenting the measured quality. The number four in the scale presents neutral position when users are not sure about their answers. The study designed SDS to measure human personality features such as honesty. They explored five, six, seven, and ninepoint scales and suggested the seven point scale is the best for such an area as it is not too big or too small and it has neutral choice. They added that the nature of data and subjects, and the results of the pilot are important for making such decisions, which can be critical and important considerations for easier analysis and measuring result interpretation. Another similar study by [30] investigated the use of SDS in social psychology research for the analysis of people’s reactions to stimulus, words and concepts using a sematic differential scale. Data used for this experiment was from people of different cultures about their attitude. The study developed a scale for attitudes measurement. The result suggested a favourable cost effective, easy set-up and reliable differential scaling system.
Investigated the impact of the number of divisions in a perceptually uniform colour scale [28] . They found that the rate of errors increases with the increase in number of divisions of the scale. The haemoglobin red colour scale is a typical example of such diagnostic methods which was explored by [22] and Critchley and Bates (2005). It is a linear scale with six shades of red representing haemoglobin levels between four and fourteen. These levels in the Haemoglobin colour scale refer to red intensity where the higher the intensity, the higher the blood count.
2.3.1 Using colour scale in cellulitis diagnosis
According to the currently available resources, it was found that only [26] developed a clinical scale and severity index for preseptal cellulitis in children. They created a single scale to describe different levels of severity when diagnosing children between one and sixteen years old with cellulitis.
Claimed that when they started their attempt, there was no standard objective clinical method available to rate the severity level of preseptal cellulitis and its response to treatment over time [16] . However, there are many non-standardised methods used.
The key contribution by Vu incorporates the main symptoms of cellulitis in one single scale. The scale includes local features such as location, erythema or redness, tenderness and pain. It also includes the systemic features such as interaction and fever. Each feature was divided in the scale into three levels. For example, erythema or redness was divided into minimal, red and ecchymotic.
The scale was developed by a group of four experts. The validity and reliability of the scale were evaluated after using the scale in assessing seventeen case studies of cellulitis. They reported another experiment of one hundred and four photographs showing cellulitis assessed by eight medical experts, ophthalmologists, emergency doctors and general practitioners who were not involved in the care of those children. They found high accuracy in their results when compared with the results of a global score, which is widely used for measuring clinical impressions.
In a third experiment conducted by the same researchers, they took instant photographs for all the case studies and asked three ophthalmologists to rank them using their severity index. They found that there is a moderate correlation between their results and the results of other experiments when using the index and global score [26] they interpreted the moderate results because the experts could not recognise all the medical features such as fever, pain, and tenderness.
The current study investigated the colour red in digital images showing cellulitis and how different types of observers, including medical doctors, and non-healthcare professionals described, grouped, and ranked the images based on their red colour. The development of redness needs to be measured and monitored over time in relation to its size and intensity. Other medical conditions are well-defined and can be diagnosed by GPs and nurses in face-to-face consultation, or by the specialist during the real time teleconsultation. Also in some cases it can be reported by the patient or carers.
Stated that their scale can be used as an objective and accurate tool to diagnose children with this condition and also, with some modifications, can be applied to other medical conditions [26] . They added that this tool can help any healthcare professional or new practitioners with basic clinical experience, as it is easy to follow and was tested with different medical doctors and professionals and not only experts.
3. Cellulitis Pathology
Cellulitis is one of the many diseases of the skin and the subcutaneous tissues below the skin surface. It is defined as a bacterial infection caused by Group A Streptococcus and/or Staphylococcus. It can infect both the lower and the upper part of the human body such as legs, face, breast, feet, hands, torso, neck and buttocks [23,29]. Cellulitis appears on the skin as red, hot, swollen, tender and poorly demarcated area of the skin which occurs as wounds and could be as a result of breaks in the skin due to surgical wounds, trauma and also injury caused by ulcers, eczema, psoriasis, tinea infection, and injection from drug use and human or animal bites. All these features of cellulitis appear as an opening of the skin [23,29].
Cellulitis has a wide range of symptoms and patients with this pathology can show some or most of the well-known features on the skin such as warmness, poorly demarcated skin, erythema/redness, tenderness, swelling and pains. Also the patient can show some health conditions such as malaise, fever, chills, toxicity, coughs, headaches, pruritus arthritis, and diarrhea [23] . Patients with a medical history of diabetes mellitus, leg ulcers, lymphedema, varicose veins, athletes foot, trauma, lymphatic compromise and alcohol abuse are more likely to develop cellulitis than others [29] .
According [23] doctors initially diagnose cellulitis by conducting a full medical assessment, which includes: patients’ medical histories, to assess whether the patient has diabetes, tetanus or other associated diseases, location of the cellulitis on parts of the body such as legs, face, breast, feet etc, measuring the size of the affected area and marking with a pen in order to monitor the spreading of redness over a period of time; identifying the reason for the opening of the skin which may be as a result of needle punctures, leg ulcers and other related injuries; conducting a physical examination of the affected area in the skin to observe if there are symptoms of redness, swelling, warmth, fever, tenderness, pains or other associated symptoms, and investigating the overall health condition of the patient for any visible symptoms like fever, coughs, chills and toxicity.
The above studies also stated that cellulitis may be diagnosed further by taking a sample of the patient’s blood or fluid from the edge of the cellulitis to test for the presence of gram positive streptococcus and staphylococcus bacteria. They added that early diagnosis of cellulitis can usually be treated by applying intravenous antibiotics, surgical drainage or debridement.
The rationale for using cellulitis as an example is predominantly due to the classical signs of redness, inflammation and swelling. These signs are usually subjectively diagnosed by general practitioners or by other medical staff in hospitals. Hedrick (2003) stated that erythema or redness, warmness and tenderness are the most common and key symptoms for the initial diagnosis of cellulitis.
Cellulitis is not a life threatening pathology in most cases but its reoccurrence can be a drain on the health resources of a country [23] . It was reported by [29] that in the USA alone there are over 600,000 cases of hospitalisation and over 9 million cases of patient visits due to cellulitis. This huge number of cases cannot be ignored, hence the focus of this study on investigating redness as one of its key symptoms with a view to using telehealth to classify the level of redness, which can aid the diagnosis process and improve the provision of healthcare services.
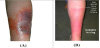
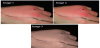
The study investigated the role of the colour red, and its perception by doctors in telehealth, more specifically how they described and classified the colour red during their diagnosis of cellulitis and conjunctivitis. The study tested the importance of using colour scaling during the classification process and the level of accuracy when using the colour red scales. Later chapters will provide more details on the experimental work that was conducted. The following images in figure 1 are examples of typical mild and severe cellulitis showing the varying degrees of colour in its development from mild to severe.
Previous studies by [27] have suggested that using medical images to standardise diagnostic assessment can improve accuracy of record keeping and also minimise subjectivity when compared to verbal descriptions with an arbitrary scale for severity.
4. Cellulitis Experiments Objectives
The study investigated the impact of the medical background on human colour perception in teleconsultation. Therefore, to test whether human colour perception is generic or subject to medical background through comparative analysis between the answers from participants including doctors and non-doctors.
The following are the experiments that were carried out in this study;
- Skin colour open description (Denoted as Experiment 1A) the participants were presented with 5 images of skin infection and asked to describe, in their own words, the degree of redness.
- Skin colour categorised description (Denoted as Experiment 1B) the above task was repeated with the difference that the most common descriptors appearing in the results of experiment 1A were provided as categories into which the images were to be located.
- Skin colour open grouping (Denoted as Experiment 2A) nine images were provided and the participants asked to group them by degrees of similarity.
- Skin colour categorised grouping (Denoted as Experiment 2B) Was a repeat of 2A , except that categories of “high”, ”medium” and “low” were provided for the participants’ guidance.
- Skin colour open ranking (Denoted as Experiment 3A) the same images used in experiment 2 were provided and the participants were asked to rank the images by intensity of colour.
- Skin colour categorised ranking (Denoted as Experiment 3B) this was a repeat of 3A except that a scale of intensity from 1 to 9 was provided, into which the images were to be categorised.
- Skin image quality rating (Denoted as Experiment 4A) a total of 144 images were supplied, being 12 images each with 12 progressively degraded versions. The participants were asked to rate the images in terms of their quality and definition.
- Skin image quality rating (Denoted as Experiment 4B) with different group of participants) A repeat of 4A but with a different group of participants, and using only 36 images (based on 12 versions of 3 original images), which were among those used in experiment 4A.
The above series of experiments were designed to test the impact of introducing different types of scales when judging the red color, each experiment was repeated again in order to introduce the scale factor for both doctors and non-doctors.
4.1 Participants
In experiments 1A,2A,3A and 4A, the total of 190 participants took part. They comprised 73 non-medically qualified students of computing, and 64 medical doctors. On this occasion, female participants were included, 24 in total, which made the sample more representative.
In experiment 1B,2B,3A and 4B, a total of 53 participants took part, 23 of whom were qualified medical doctors and 30 non-medically qualified computing students. In this instance, 8 female participants took part.
4.2 Design and variables
Although, these experiments took place in two different buildings, great care was taken to ensure that the two environments were as close to identical as was possible, in terms of ambient lighting and supplementary electrical lighting.
Independent checks were carried out by a professional medical illustrator to ensure that the two sets of circumstances were as near as possible to identical.
All participants received the same instructions and were given the same time to perform the experimental tasks. The experiments were designed with handouts, which contained the images (examples presented below), the experimental tasks and answers sheets. All tasks were explained, in both verbal and written form, to the participants.
The independent variables were the tasks of the experiments, the colour characteristics, and the use of the colour scale, the image quality, and the environmental conditions. The dependent variables were the participants’ responses to the experiments (describing, grouping, ranking and rating images).
The questions related to each experiment were distributed in a random order, which ensured that the performance of the users was not influenced by the order of the tasks, which may have affected the results. Master data was collected in tables which contained participant’s information and performance in describing, grouping, ranking, and rating the images provided.
All participants were assessed for colour blindness before participating in the experiment and the data analysed was only that applicable to users who were not colour blind. The participants were informed at the beginning of the experiment about all the related ethical issues such as their right to withdraw at any time from the experiment without providing any reason.
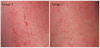
The 5 images used in experiments 1A and 1B (Figure 2), the 9 images used in experiments 2A, 2B (Figure 3), 3A, 3B (Figure 4), the 144 images used in experiments 4A and 4B (Figure 5). The following are examples of the images used in the experiment;
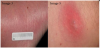
Q: Experiments 1A and 1B. Describe the colour based on level of redness
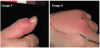
Q: Experiments 2A and 2B. Group the images based on intensity of redness.
Q: Experiments 3A and 3B. Rank the images based on degree of redness.
Q: Experiments 4A and 4B. Rate the images based on image quality.
5. Results and Discussion
Detailed below are the results of all experiments, together with analysis of the performance of all participants and the comparison of doctors to non-doctors.
5.1 Results for experiments 1A and 1B (image description)
The chart presented above shows a sample of percentage frequency of answers by participants on experiment 1 with image 1 (Figure 6). Results for all other images on the same experiment are presented in appendix 1 and discussed below.
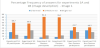
In all five images, the majority of opinion amongst all participants was that the red area of infection could be described as “medium red”. What was interesting, however, was that after introduction of additional guidance, in experiment 2B, there was a clear shift of opinion across the range in several cases. In image 1, for example, there was a 14 point movement from “dark” to “medium” and a corresponding shift of 17 points from “medium” to “light”. A similar shift of opinion could also be observed in the case of image 5. This indicates that the presence of additional information has a definite effect on the participants’ judgement.
Table A in appendix 1 showed the changes of opinion of participating non-doctors from experiment 1A (with no guidance) to experiment 1B (with guidance). The results showed very little shift in opinion in relation to images 1 and 2, but there is a clear shift in opinions in the cases of images 3, 4, and 5.
With a few exceptions, there is a reasonable degree of concordance, in the evaluation of red intensity, between both doctor and nondoctor participants. When viewing the images, it seems that a likely reason for this may be the absence of natural skin context within the image, which would provide comparison. This may be a case where the training and experience of qualified doctors has permitted them to judge the degree of red intensity differently from the non-medical participants.
Of more significance is the fact that both groups were influenced to very similar degrees by the additional guidance provided in experiment 1B. In both groups, there is little change of opinion until image 3 where the assessment of both groups of participants begins to change. This continues to be the case through images 4 and 5. Again, this may be because of the areas of unaffected tissue, which provide context for the inflamed areas and makes visualisation of the degree of infection simpler.
The above experiments 1A and 1B confirm that there is a definite shift in opinion when a descriptive colour scale is introduced. However, although the doctors who took part in the experiment showed slightly more acumen in applying the scale, the results were not sufficiently conclusive, i.e. that the ability of the doctors would be enhanced by their prior training.
5.2 The results of experiments 2A and 2B (image grouping)
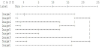
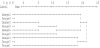
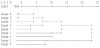
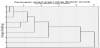
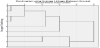
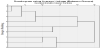
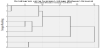
The following figures 7a to 7d inclusive show hierarchical cluster analyses for image grouping experiments 2A and 2B.
Dendrogram using average linkage (between groups), rescaled distance cluster combined.
Dendrogram using average linkage (between groups), rescaled distance cluster combined.
Dendrogram using average linkage (between groups), rescaled distance cluster combined.
Dendrogram using average linkage (between groups), rescaled distance cluster combined.
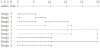
The four dendrograms shown above were analysed and for clarity of presentation the results were summarised in table 1 and table 2 below.
As is clearly shown in table 1 and table 2, there is virtually no difference between doctor and non-doctor participants in grouping digital images based on their colour intensity. As with experiment 1A and 1B, these experiments again fail to affirm the respective ability of doctors and non-doctors.
5.2.1 The results of experiments 3A and 3B (image ranking)
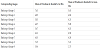
The following section presents the results and analysis of the consistency of participants in experiments 3A and 3B. It also provides a comparison of the performance of doctors and non-doctors. Using the experience gained from previous experiments, and applying the principles of agile methodology, in experiment 3B the participants were given clear instructions that the numeric grading scale would begin at 1 for the least level of colour intensity and end at 9 for the highest intense colours, thus avoiding the occurrence of reversed scales experienced in previous experiments.
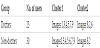
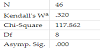
Because there is variation of data in this case (i.e. for each individual we have a range of values from 1 to 9), Friedman’s and Kendall’s tests were used, which show the degree of agreement among the sample of respondents in how they rank the nine images. Kendall’s coefficient of concordance is the most relevant in this case. (Actually Friedman’s and Kendall’s are identical in this case because the data is already ranked). Kendall’s coefficient ranges from 0, indicating no agreement among the sample individuals, to 1, indicating perfect agreement.
The results from the table 3 show that Kendall’s coefficient (W) is 0.249 which indicates low agreement or consistency among the participants. In other words, the significance of Friedman’s test and Kendall’s coefficient indicate strong differences in the rankings.
Poor levels of concordance were demonstrated by both groups (table 4 and table 6), with a very marginally better performance by doctor participants. Kendall’s W for doctors = 0.320 and for nondoctors = 0.248.
Very low levels of agreement were demonstrated in table 7 and table 8, despite the inclusion of a numeric scale, and precise notes on its application, within the question paper of experiment 3B (Table 9) (figure 8a and figure 8b).
The level of agreement in experiment 3B(table 10) (figure 9a and figure 9b) was actually lower than in 3A, although the results may have been skewed by the smaller sample size (53 participants vs. 119 in 3A).
Comparison of the performance of doctors and non-doctors in experiment 3B showed that there was very little difference between the two groups, doctors being only slightly more in accord, but both groups showing very low levels of agreement. Kendall’s W for doctors = 0.165 and for non-doctors = 0.050. Reference to the dendrograms (Figures 5 to 10) graphically illustrate the generally random nature of the distribution and the lack of concordance.
It should be noted that the variations in redness levels demonstrated within the experimental images was quite subtle in the majority of cases, only a couple of the images displaying extremes of redness (e.g. image 8 and 9).
There were several possible reasons for the lack of concordance within these experiments. Firstly, the nature of cellulitis makes judgement difficult as its appearance can vary, not only with the degree of severity, but also with differing skin types. Secondly, the photographic images provided may not have contained sufficient context. It was notable that when the clusters within the dendrograms were compared to the experimental images, those images containing healthy skin context were almost invariably clustered together (images 4, 5 and 6). Finally, it is possible that a scale as large as 1 to 9 may have proved to be excessive, and perhaps a more limited range of scale, would be more appropriate.
It may also be the case that a photographic frame of reference may be better than a numeric system. These issues were further examined within the conjunctivitis group of experiments (applying agile methodology).
5.2.1 Results of experiments 4A and 4B (image quality rating)
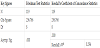
Kendall’s coefficient of concordance was calculated for both doctor and non-doctor participants in experiment 4A. For 72 non-doctors, Kendall’s W = 0.270, p = 0.000. For 46 doctors, Kendall’s W = 0.353, p = 0.000. The statistics showed that there was a poor level of agreement between the participants in both groups.
Comparison of the two groups was carried out using Mann Whitney tests. The results ranked non-doctors slightly higher than doctors at 63 vs 55. Mann Whitney U = 1457.
Z = -1.211 and p = 0.226 showed that the differences between the two groups was not statistically significant.
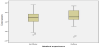
As a further confirmation, and in order to assist with analysis of the results a graphic representation generated as an SPSS boxplot displaying the correlation between the answers of individual participants and the true values of the images (obtained from Photoshop modifications made to the images ) for both doctor and non-doctor participants.
As experiment 4B was a cut-down repeat of 4A (Figure 10), it was decided to carry out analysis of the reasons for the inconsistencies after consideration of the basic results of 4B (figure 11).
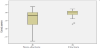
Kendall’s coefficient of concordance was calculated for both doctor and non-doctor participants in experiment 4B. For 29 non-doctors, Kendall’s W = 0.218, p = 0.000. For 23 doctors, Kendall’s W = 0.470, p = 0.000. The statistics showed that there was a poor level of agreement between the participants in both groups.
Comparison of the two groups was carried out using Mann Whitney tests. The results ranked non-doctors slightly lower than doctors at 26 vs 27. Mann Whitney U = 332.
Z = -0.233 and p = 0.816 showed that the differences between the two groups was not statistically significant.
The difference between the performances of the two groups of participants becomes very clear when presented in a boxplot format (figure 5-10).
Examination of the results of all participants in all of the questions brought a number of issues to light. It is fair to say that, in all cases, the results were very poor in terms of both accuracy and consistency. It was clear from the data that, had the results of the participants been averaged, they would, in the majority of questions, have been close to the correct result (albeit with large degrees of variation), except in the case of the highest quality images. There appears to have been an aversion to the use of the higher values in the scale, even the highest quality images (rated at 9) were only evaluated at between 5 and 6 by the participants, who applied very similar values to those images which were a true 5 or 6. This poses the question as to whether the scale of reference was too large and if a narrower scale, of say 1 to 5, might be more appropriate. Another view of this may be to suggest that human ability to differentiate between levels of image quality peaks at a point below that which we are able to attain with modern imaging equipment. A further consideration is that perhaps the degrees of degradation used in the experimental images were too close together for accurate judgement to be made.
It was apparent from looking at individual results of the experiments that, once again, the poor levels of concordance were exacerbated by a number of errors which would be hard to explain other than to assume that they were lapses of concentration. In several instances participants, who had evaluated the images reasonably closely to the true values, inexplicably rated images with true values of 1 or 2 as being a 9, which was a total reversal of the scale and could only be viewed as inattention in application of the scale.
Such lapses may be unsurprising in view of the fact that the participants were dealing with large numbers of images and such lowlevel repetitive work may lead to such slips [8] .
6. Conclusion
It was apparent from the results of these experiments that diagnosis of cellulitis, using current telemedicine techniques, presents a great challenge. Throughout the whole range of experiments, very poor levels of concordance, consistency and accuracy were achieved. The question, which had to be addressed, was, were the problems with the results caused by human inaccuracy when performing the experiments or by the design of the experiments themselves. Several points became clear during analysis of the results. Firstly, there was little or no difference between the respective performances of doctor and non-doctor participants in any of the experiments, which confirmed the null hypothesis of no difference.
Secondly, it was clearly the case that evaluations of the images, by the participants, were modified by the introduction of numeric scales as a term of reference. This finding disagreed with the null hypothesis where no difference was expected. What became apparent, however, was that introduction of a scale brought problems of a different type into the equation. It was clear that, on a number of occasions, the instructions for use of the numeric scale were misunderstood, misapplied or forgotten. There were also reasons to believe that a scale utilising pictorial comparisons would prove to be of more value than a simple numeric scale. A further indication was that the numeric scales employed were often too large in range for accurate evaluation to be performed, and that a shorter scale with wider parameters may have been more effective.
With regard to hypothesis of no relationship would be established between confidence and accuracy, the findings of these experiments confirmed that no such relationship existed. Additionally, although no time constraints were placed on the participants, for the completion of the experiments, the time taken appeared to have no influence on the level of accuracy. Another Null hypothesis proposed that there would be no significant difference between doctors and non-doctors in relation to their confidence levels or time spent in the conduct of the experiments. Once again, the results tended to confirm the null hypothesis.
Competing Interests
The authors declare that they have no competing interests.