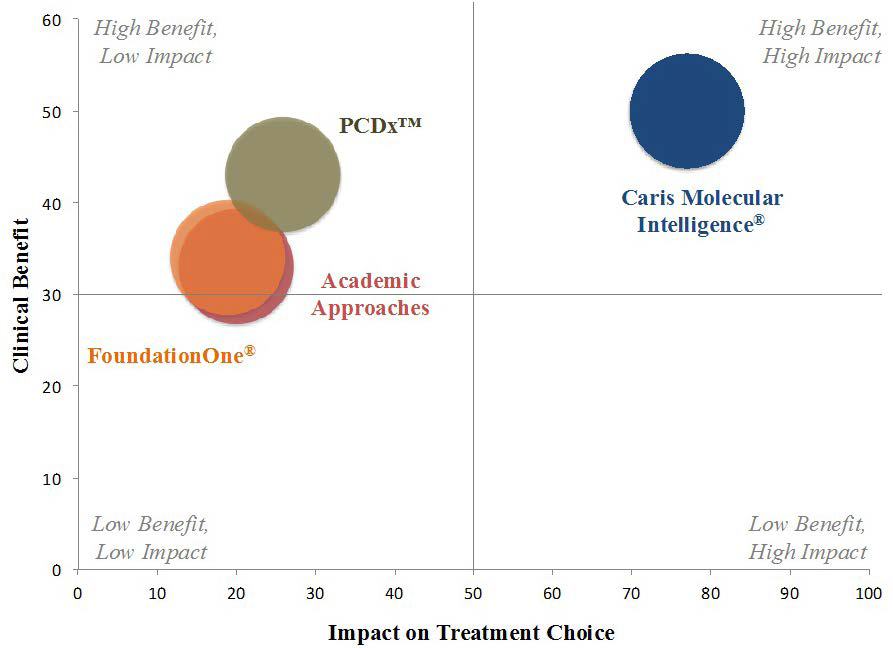
Figure 2:
Representative graph of relative clinical utility showing decision choice impact and clinical benefit of different profiling approaches.