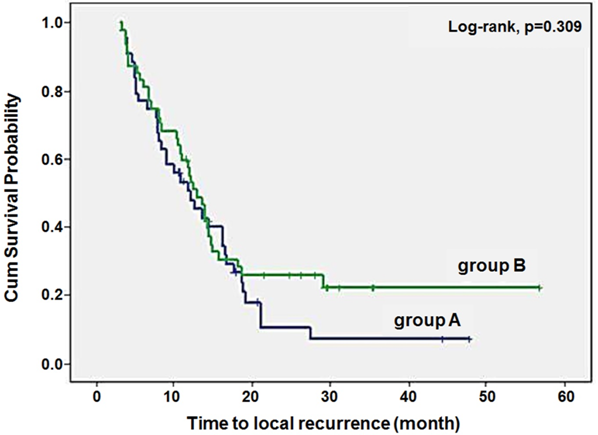
Figure 1:
Kaplan-Meier survival curve for groups A and B.