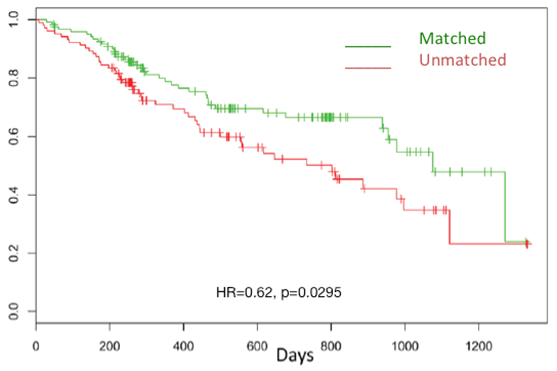
Figure 4: Kaplan-Meier curve showing the increase in overall survival from time of profiling for those patients treated only with therapies predicted to be of benefit by their molecular profile compared to those patients who received at least one therapy predicted to be lack of benefit [29].