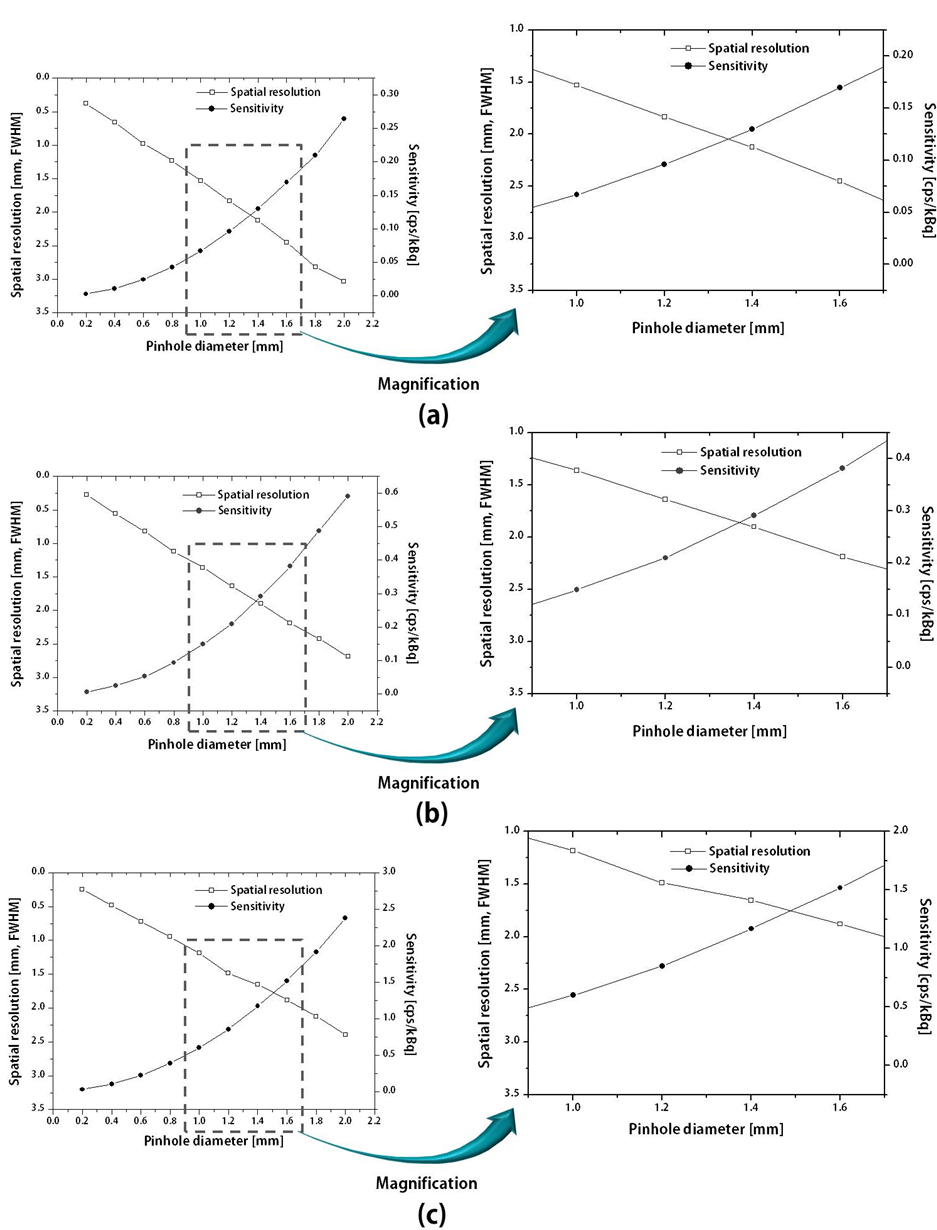
Figure 5:
The trade-off curves of sensitivity and spatial resolution as a function of the pinhole diameter for each magnification factor of (a) 2, (b) 3, and (c) 6. Right graphs are magnification view of dashed line of left.