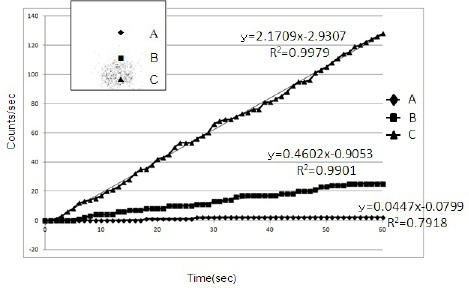
Figure 9: Progress of the intigrated acquisition count by unit at time point A, B, and C.(Phantom II) image of 1-s (acqusition).
The Y -axis represents the count per secound and the x-axis denotes the time (s).
The Y -axis represents the count per secound and the x-axis denotes the time (s).