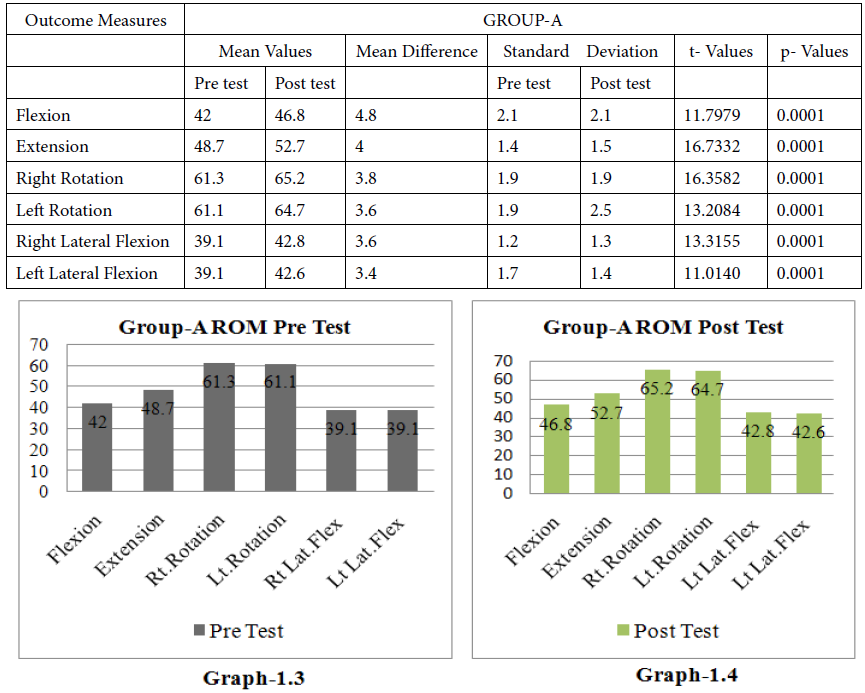
Table 2: Shows the significant difference between pre and post-test within the Group A PRT. The paired “t” test shows Flexion mean difference as 4.8 and statistically significant (p=0.0001). Mean difference for Extension is 4 and statistically significant (p=0.0001). Mean difference for Rt Rotation is 3.8 and statistically significant (p=0.0001). Mean difference for Lt Rotation is 3.6 and statistically significant (p=0.0001). Mean difference for Rt Lateral flexion is3.6 and statistically significant (p=0.0001). Mean difference for Lt Lateral flexion is 3.4 and statistically significant (p=0.0001).