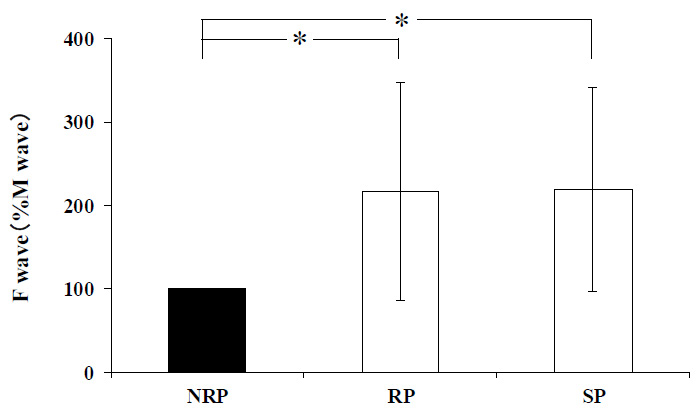
Figure 5: Comparisons of F wave in NRP, RP and SP.
The F-wave rate of each condition was calculated, using the values when NRP as 100%.
The error bars indicate the standard error of the mean. Significant difference *p<0.05.
The F-wave rate of each condition was calculated, using the values when NRP as 100%.
The error bars indicate the standard error of the mean. Significant difference *p<0.05.