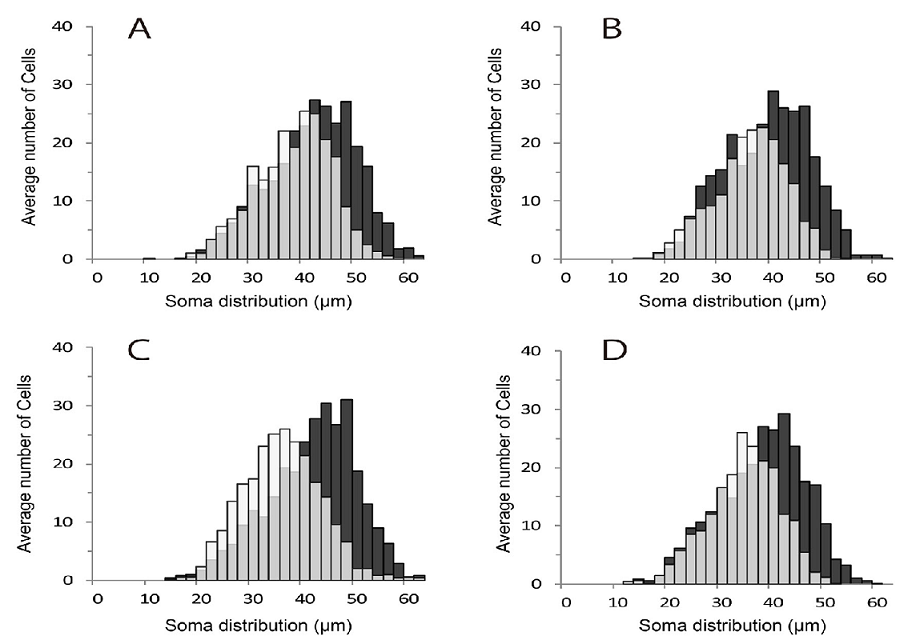
Figure 3: Distribution of the soma diameters of Abd motoneurons.
A: size distribution of T13 in 6WC and 6WD. B: size distribution of L1 in 6WC and 6WD. C: size distribution of T13 in 14WC and 14WD. D: size distribution of L1 in 14WC and 14WD. 6WD: animals 6 weeks after induction of diabetes, 14WD: animals 14 weeks after induction of diabetes, 6WC: control animals 6 weeks after injection of saline, 14WC: control animals 14 weeks after injection of saline, T13: 13th thoracic spinal cord, L1: 1st lumbar spinal cord.
The vertical axis shows the number of cells, and the horizontal axis shows average diameter. Control: ■, Diabetes: ☐. Overlap area of controls with diabetic animals are indicated in gray.