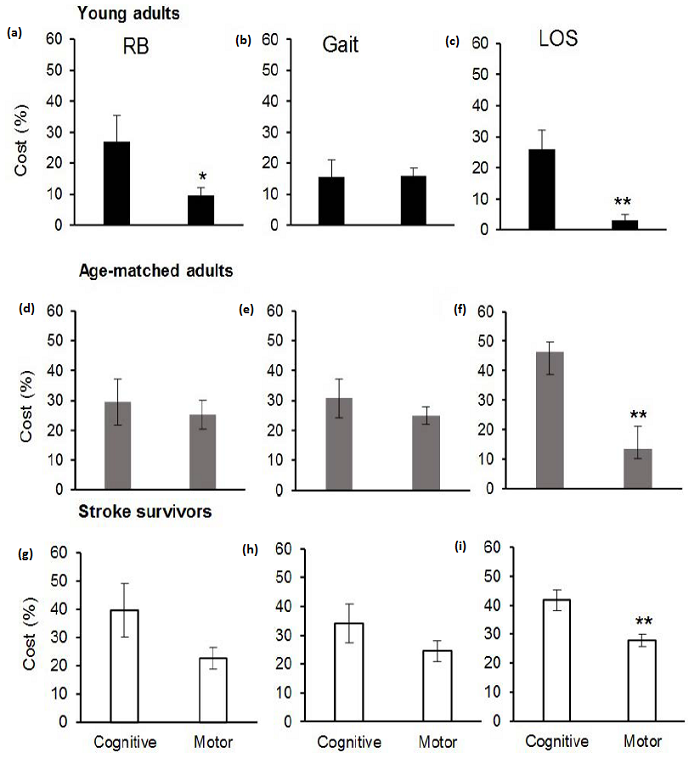
Figure 3: Comparison of motor and cognitive costs for each of the balance tasks (RB = Reactive balance, LOS = Limits of stability) within young adults (a-c), age-matched adults (2-f) and stroke survivors (g-i). * indicates p < 0.05 and ** indicates p < 0.01.