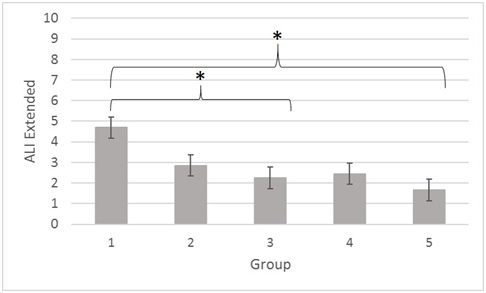
Figure 2: Mean values for ALI_extended and %Pmax predicted. Note: Group 1 < 100%Pmax predicted (80 - 100%), group 2 people within normal range (100 – 120 %Pmax predicted) and groups 3 (120 – 140%Pmax predicted), 4 (140 – 160 %Pmax predicted) and 5 (160 – 180%Pmax predicted) people above normal range of CRF. * p< 0.05.