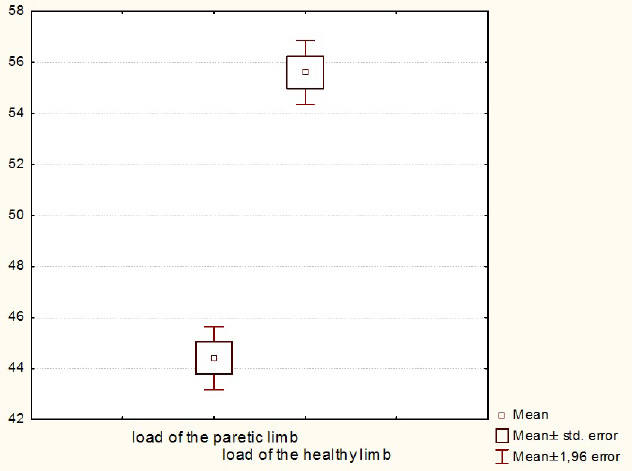
Figure 1:
Analysis of the load differential between the healthy and paretic LLs.