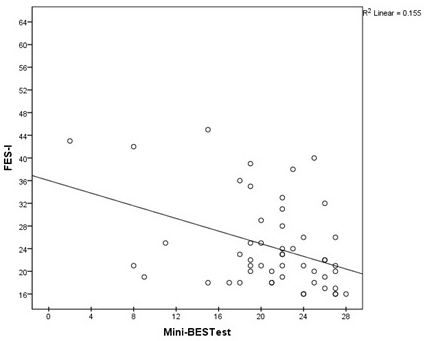
Figure 2:
Scatterplot of total scores for Mini-BESTest and FES-I.
Trendline for the correlation superimposed (n = 52).