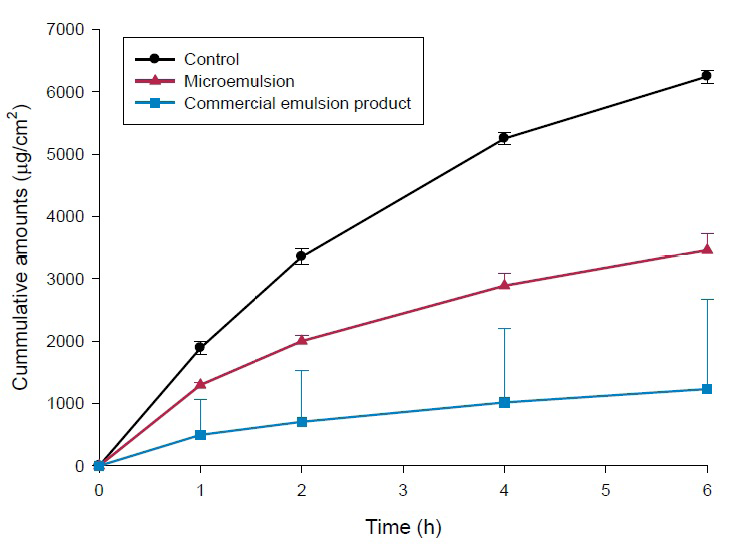
Figure 3:
In vitro release of AA2G across a cellulose membrane from control, microemulsion and commercial emulsion. Each value represents the mean±S.D. (n=4).