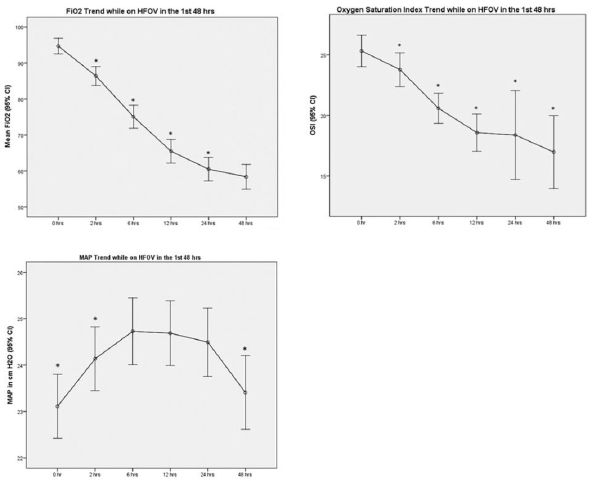
Figure 1: Mean changes and 95% CI in Fraction of inspired O2 (FiO2), Oxygen Saturation and Mean Airway Pressure (MAP) for 48 h after application of high frequency oscillatory ventilation.
The parameters at 0 h were recorded immediately after starting high frequency oscillatory ventilation (HFOV). Values of each parameter were compared with preceding parameter using Wilcoxon signed ranks test. *p < 0.05.
The parameters at 0 h were recorded immediately after starting high frequency oscillatory ventilation (HFOV). Values of each parameter were compared with preceding parameter using Wilcoxon signed ranks test. *p < 0.05.