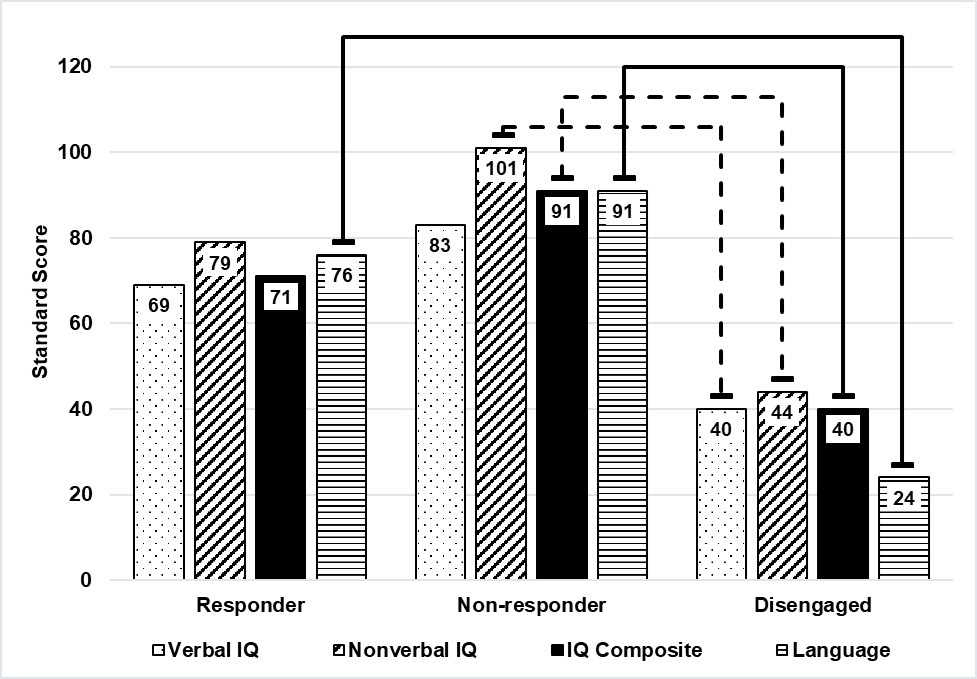
Figure 4: IQ and language skills of intervention subgroups at baseline. Solid line indicates significant difference (p < .05). Dashed line indicates trending difference (p < .07). Standard scores have a mean of 100 and a standard deviation of 15.