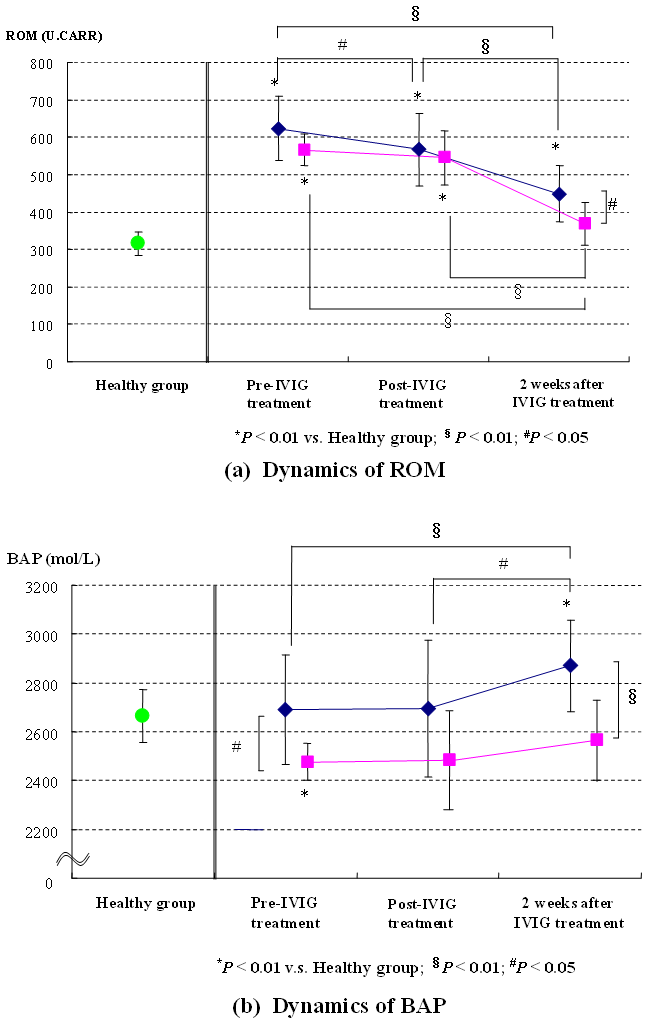
Figure 2: Dynamics of reactive oxygen metabolites and biological antioxidant potential during the acute stage.
a) Dynamics of reactive oxygen metabolites. Reproduced from [11] with permission from © 2011 by the Japanese Circulation Society. Changes in the levels of reactive oxygen metabolites (ROM) in both treatment groups (blue: favourable, pink: not favourable) in response to intravenous immunoglobulin treatment. Data presented as the mean ± SD.
b) Dynamics of biological antioxidant potential. Reproduced from [11] with permission from © 2011 by the Japanese Circulation Society. Changes in the biological antioxidant potential (BAP) of both treatment groups (blue: favourable, pink: not favourable) in response to intravenous immunoglobulin treatment. Data presented as the mean ± SD.