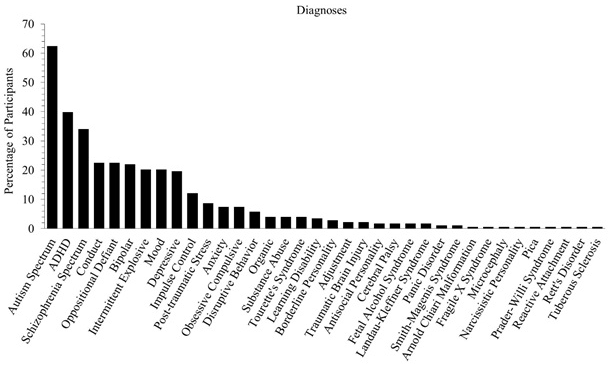
Figure 3:
The percentage of participants associated with various diagnoses. Many individuals were diagnosed with multiple disorders/ disabilities.