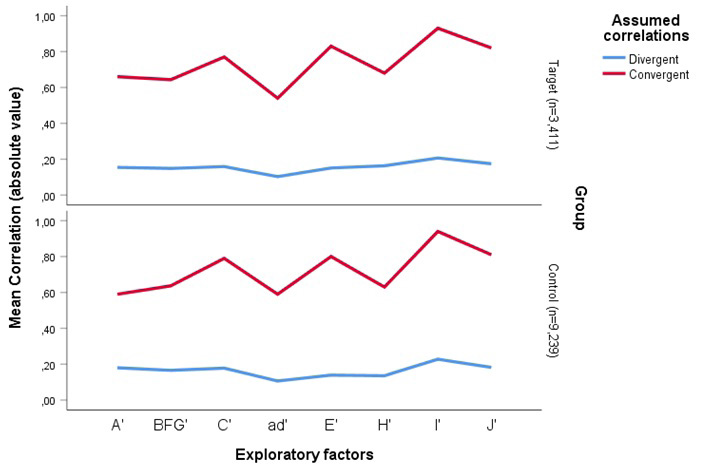
Figure 1:
Plot of assumed convergent and divergent correlations (n=80) over the exploratory factors, across groups.