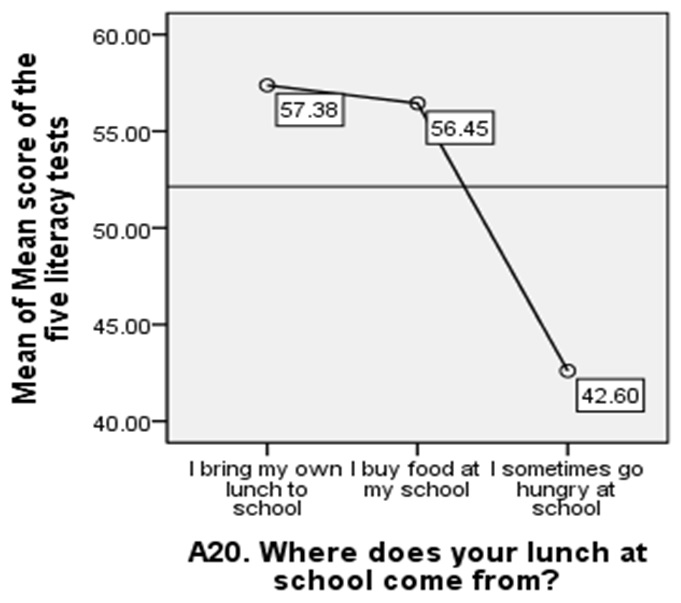
Figure 1:
Line graph showing the combined literacy means for the three source of school lunch groups.