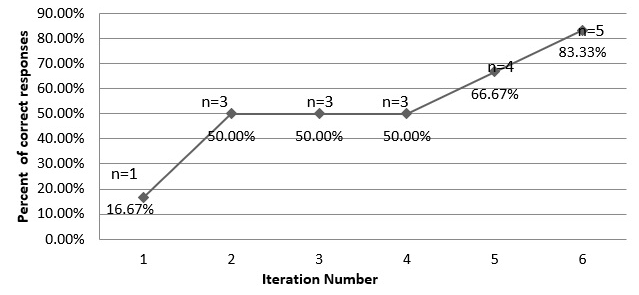
Figure 1:
Line graph illustrating percentage of correct responses for each iteration.