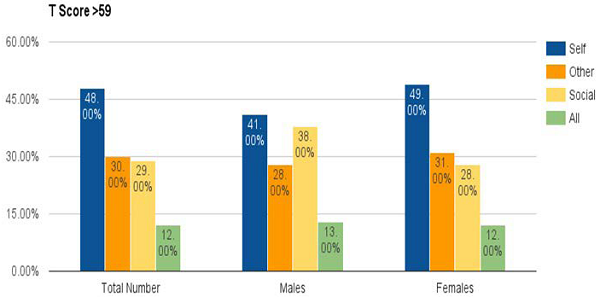
Figure 6:
Percentages of elevated T scores for all categories.