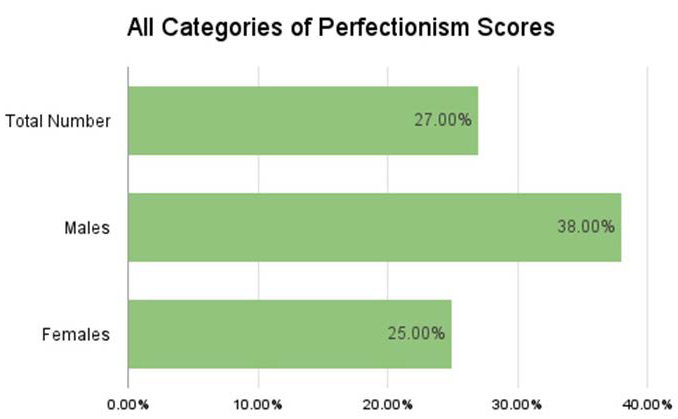
Figure 5:
Percentages of moderate to elevated T scores for ALL three categories.