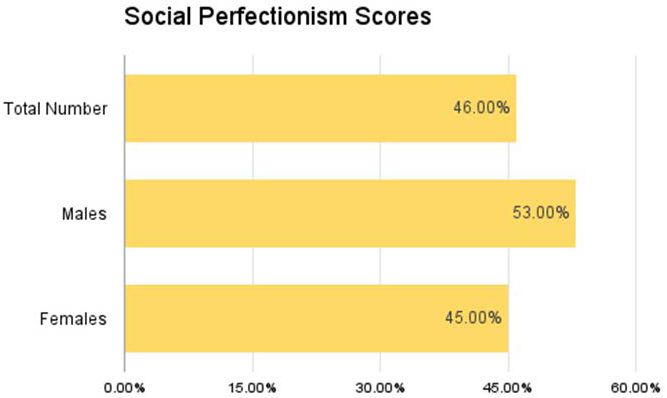
Figure 4:
Percentages of moderate to elevated T scores for Social Perfectionism.