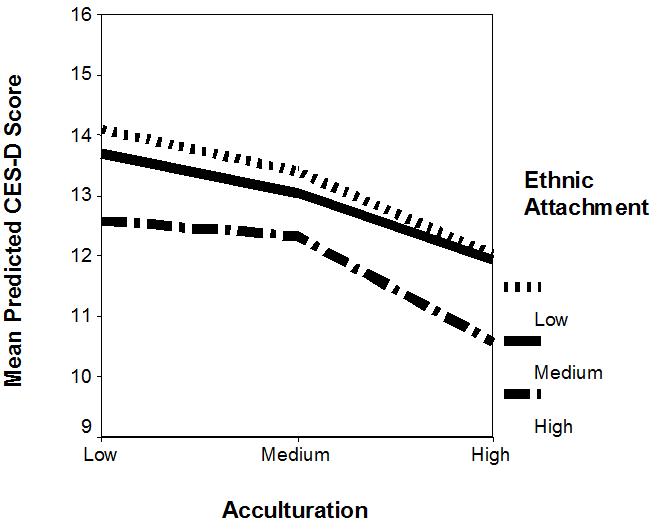
Figure 1: Predicted CES-D scores by acculturation and ethnic attachment among first generation Korean immigrants in Chicago.
Note: The CES-D range (9 - 16) covers roughly one standard deviation above and below the overall mean.
Note: The CES-D range (9 - 16) covers roughly one standard deviation above and below the overall mean.