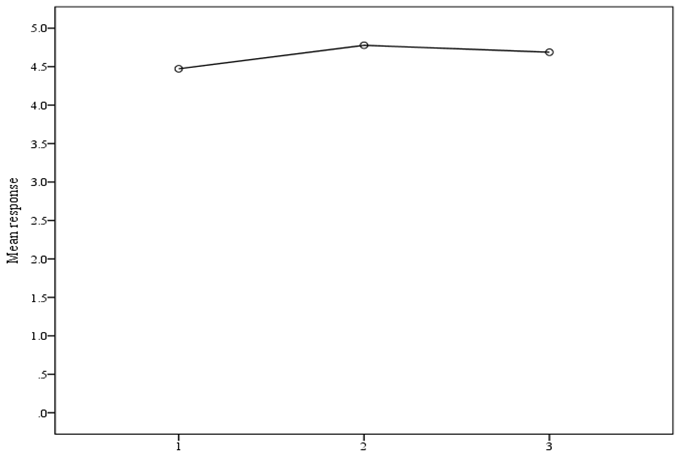
Figure 2:
Means plot comparing average responses of staff, patient, and family to survey question 10.