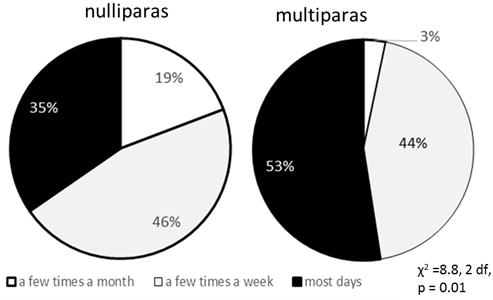
Figure 1:
The proportions of frequency of fish intake in the parity P value was calculated by the chi-square test for categorical variables to test differences between the groups.