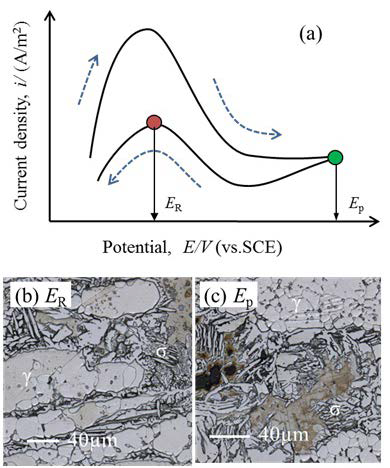
Figure 2: Schematic DL-EPR polarization curve (a), and specimen surfaces after the potential reached Ep = 300 mV (vs. SCE) in passive zone (b) and the ER = -300 mV (vs. SCE) corresponding to the reactivation current peak (c) in solution of 0.5 M H2SO4 +0.01 M KSCN +0.5 M NaCl. The specimen was continuously cooled at 0.02 K/s.