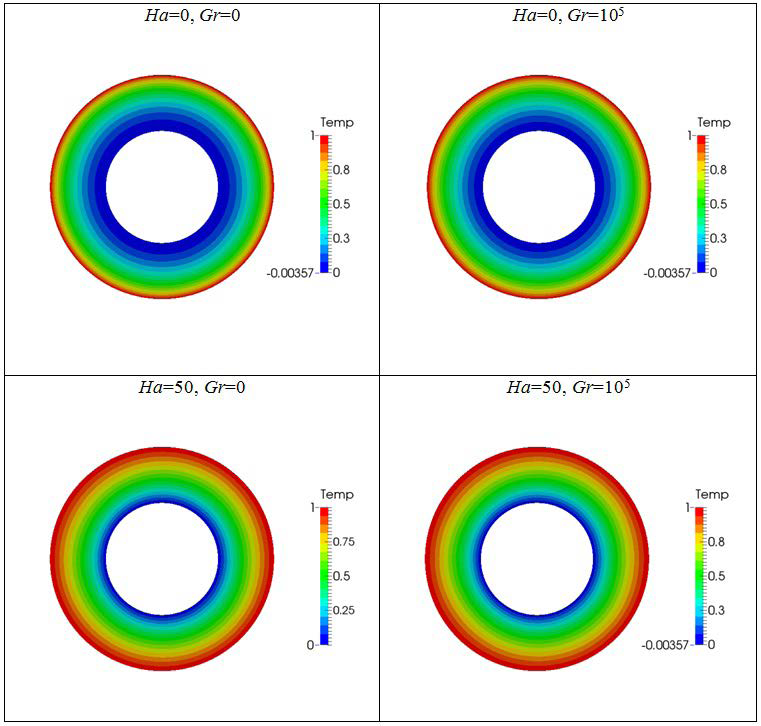
Figure 8:
Contour plot of the temperature for various Hartmann and Grashof numbers and for
Re
=1000,
k
=0.2.