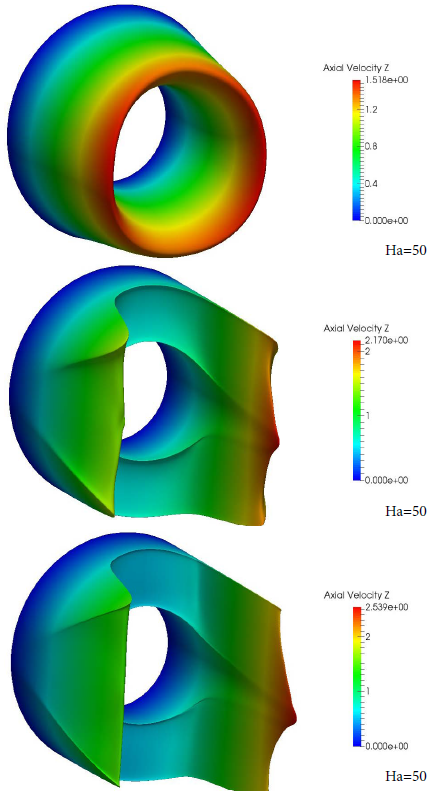
Figure 2:
3D plot of the axial velocity for various Hartmann numbers for Re=2000,
Gr
=0,
κ
=0.2. Left is the inner region and right is the outer region of the curved duct.