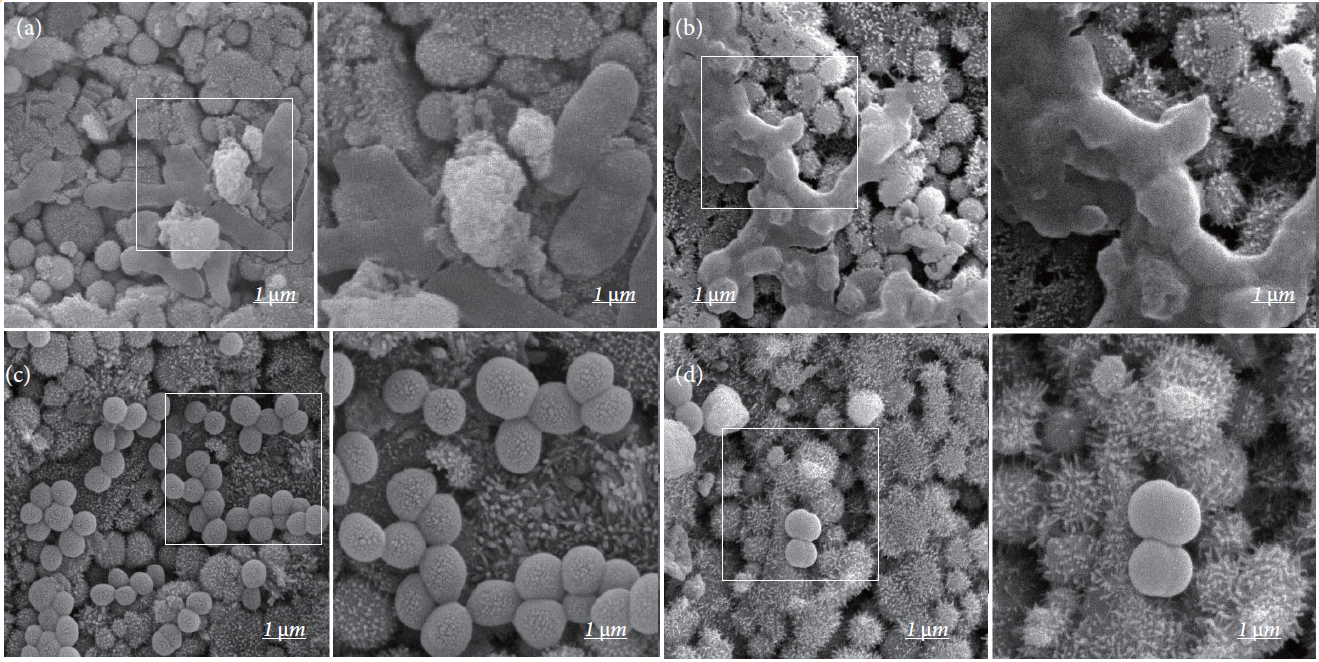
Figure 6: SEM images of bacteria on the surface of calcium phosphate microsphere discs. On CPMs (0) discs, E. coil and S. aureus displayed typical morphology (a, c). On the other hand, E. coli on CPMs (1000) changed their morphology (b). The number of S. aureus on CPMs (1000) significantly decrease (d). Each right panel shows higher magnification of the rectangular area in left panel. Bars represent 1 μm.