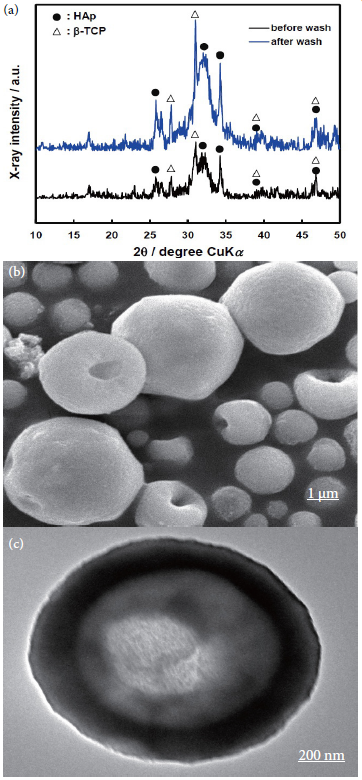
Figure 1: Characterization of calcium phosphate microspheres. XRD patterns of microspheres before and after ashing. Each powder consists of β–TCP and HAp biphase (a). SEM (b) and TEM (c) micrographs of washed powders. Bars indicate 1 μm (b) and 200 nm (c), respectively.